In our view, inflation is the most mispriced macro variable in markets today. CPI growth is 5.1% higher over the last two years, but five-year forward inflation expectations are essentially unchanged. Based on our analysis, structural forces are likely to keep the annual growth rate in consumer prices elevated for much longer and substantially higher than currently priced into markets. If inflation remains stickier than policymakers are expecting, it has profound implications for the valuation of financial assets.
Impending recession is the consensus today, but most pundits are expecting it to be mild and few are expecting one that corresponds with high inflation. We agree that an economic downturn is likely, but we think it could be more severe in terms of market impact due to the re-acceleration of inflationary pressures. If we are right, general investor positioning is off.
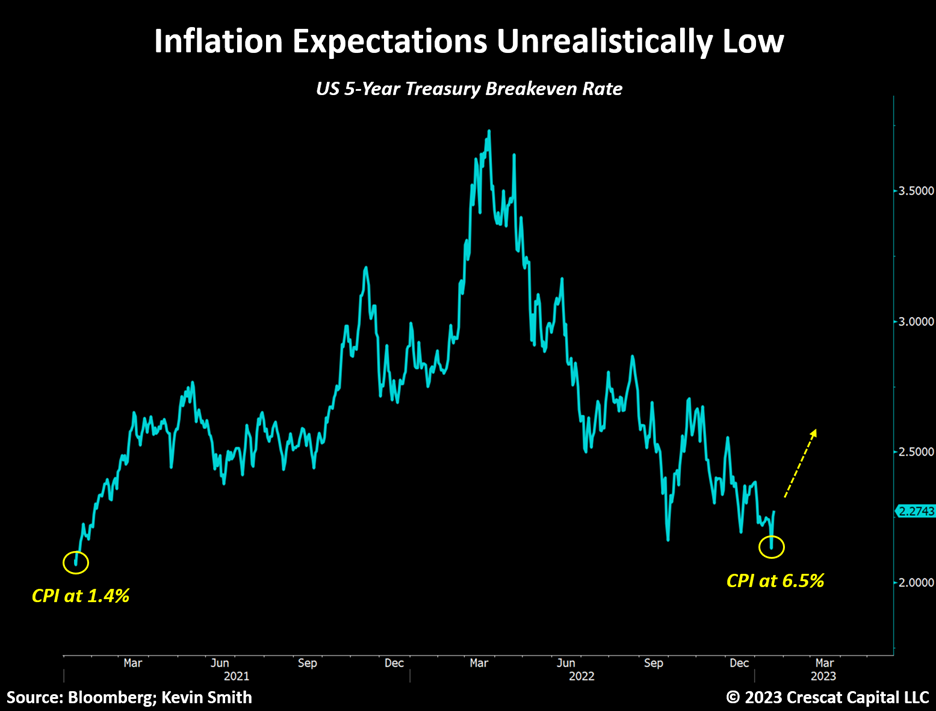
The Structural Case for Inflation
We see all five of the major structural drivers of inflation playing out over the next decade to keep CPI growth high and drive currently low expectations higher: 1. Demand-pull, 2. Cost-push, 3. Built-in, 4. Monetary, and 5. Import-led.
Below, we highlight one important aspect of each of these pillars to illustrate why inflation is poised to be much higher than currently forecasted by the Treasury markets:
1. Manufacturing Revitalization: The Inflation Reduction Act of 2022 (IRA) is a crude misnomer. As noted in a recent McKinsey study, this was the third piece of legislation passed since 2021 unleashing at least $2 trillion in government spending over the next ten years to increase US economic competitiveness, innovation, and industrial productivity. The Bipartisan Infrastructure Law (BIL) and the CHIPS & Science Act are the other two. IRA, BIL, and CHIPS are open-ended fiscal stimulus programs reminiscent of Franklin D. Roosevelt’s New Deal and Lyndon B. Johnson’s Great Society. These are all “demand-pull” drivers of rising prices, aka policy-led Keynesian stimulus. It is important to remember that the New Deal and Great Society programs of the 1930s and 1960s each subsequently contributed to the biggest inflationary decades of modern US history in the 1940s and 1970s. Incidentally, the Revolutionary and Civil War periods were the most inflationary decades in US history.
It may be true that the current set of programs is a positive driver for nominal economic growth, American competitiveness, and the US labor market. And from an investment standpoint, select companies in the industrial, energy, materials, and IT sectors should be beneficiaries, but we believe the inflationary risk of such programs is grossly misrepresented. The Inflation Reduction Act could easily be dubbed the “Rube Goldberg Plan” for the machinations of its ill-conceived energy transition policy or perhaps the “Dumb and Dumber Act” because it increases the demand for hydrocarbons at a time when conflicting government policies have reduced the supply. The stage is set for an upward oil and gas price shock.
2. Resource Underinvestment: This supply constraint is a “cost-push” inflationary factor, and in Crescat’s view, the clearest one that is destined to substantially raise prices throughout the economy due to the lag-effects of the historic 8-to-12-year decline in capital spending by businesses in the energy and materials sectors. Time and capital are necessary to increase the production of these critical manufacturing inputs. Serious supply constraints are the harsh reality that is at odds with both the existing inelastic demand of modern civilization and as well as new demand from environmental, social, and political agendas. We believe this inflationary driver is the most underappreciated of all in the markets today, especially in the commodity markets. By its own admission, the Fed’s recent tightening only addresses demand factors in the economy and can do nothing to solve the supply-side constraint of underinvestment. By hindering capital formation in the resource sector, the Fed’s tightening has likely only made this powerful structural inflationary force more potent.
3. Resurgence of Labor’s Pricing Power: Workers’ share of economic activity through wages and salaries is coming off historic lows as the workforce population growth is likely to remain constrained. This can be seen in the chart below.
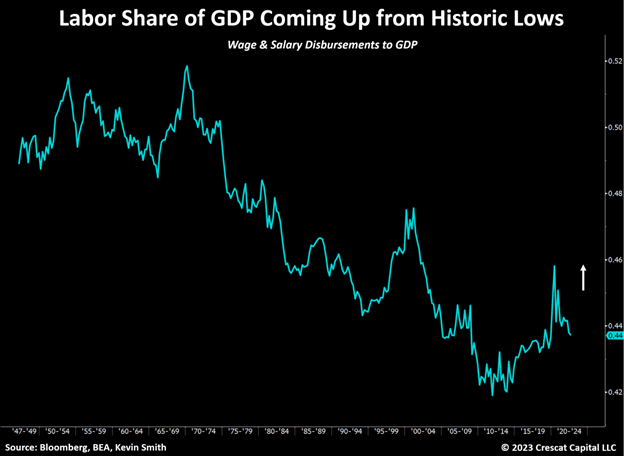
If workers have the power to demand higher wages, it can lead to a “wage-price spiral”. The concern here is the potential “building-up” of what economists call “built-in” inflation. When higher inflation expectations get built into future economic decisions by both workers and businesses, it becomes self-fulfilling. This is why policymakers are so intent on doing everything they can to keep “inflation expectations” down. However, if consumer prices continue to exceed market projections, as they have for the last two years already, people and businesses will sooner or later lose confidence in fiscal and monetary authorities. The “wage-price spiral” is the interplay of labor and businesses ratcheting up their inflation expectations, a structural juggernaut. We see this phenomenon as highly likely over the next decade. Workers should have increased leverage in this game over corporations due to the demographics of an aging population including the retirement of the baby boomers.
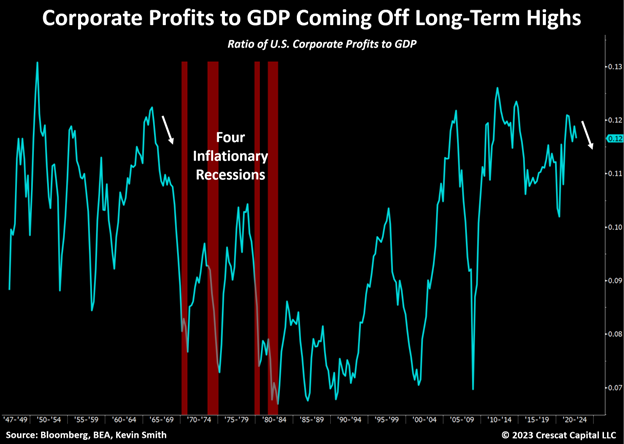
The share of GDP going to corporate profits is also coming off historic highs. This is the mirror image of labor’s increasing pricing power but also highlights the risk to corporate profits which can get squeezed in an impending inflationary recession like those of the 1970s. Though many investors may say they expect a recession, market positioning indicates more that most are still chasing overvalued growth stocks and fixed-income investments. They are not positioned for declining corporate profit margins nor higher long-term interest rates and rising credit spreads. The winners of the last economic cycle still litter investor portfolios today but face significant headwinds. We continue to see many short opportunities in these areas.
4. Monetary Lag: This is the “built-up” inflationary pressure from over a decade of ultra-easy monetary policy that led to historic stock and bond market bubbles that are now unwinding. Inflation is the self-reinforcing catalyst for the deflation of these bubbles.
We can hear the pushback already, “But Crescat, the Fed is doing QT, and M2 is contracting today?”
Indeed, the 1970s showed that rising inflation rates followed money supply growth with a 28-month average lag and during a period when M2 growth was contracting. Since the 2008 Global Financial Crisis, and up until the Fed’s tightening that began last year, it has been the longest, most aggressive monetary base expansion in U.S. history, especially when punctuated with the Covid liquidity surges, a highly risky experiment given the inflationary lag effect. If Milton Friedman was correct that “Inflation is always and everywhere a monetary phenomenon”, then there is a lot of missing inflation still destined to show up.
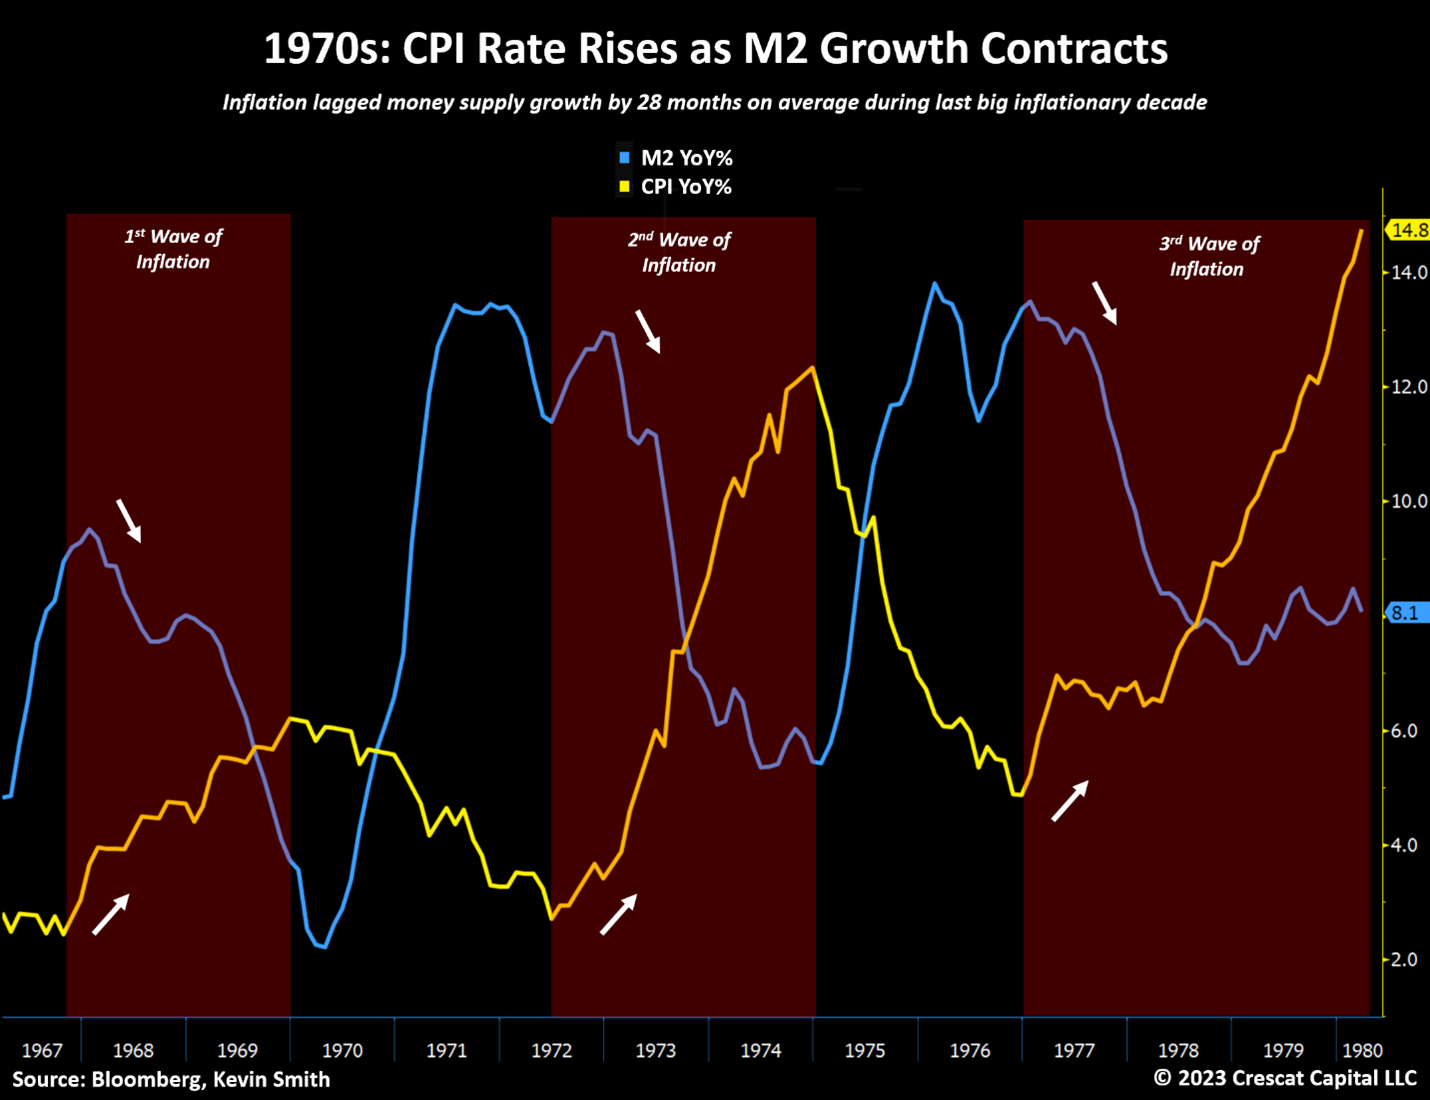
The consensus thinks that the first wave of inflation in today’s economy has peaked, and it may have, but the average inflation lag of 28 months behind the M2 surge would put the peak of the first wave not until June 2023. Note there is a large margin for error here, but also note that the M2 swings today are even more extreme than those of the 1970s which in our view increases the risk of another surge of inflation showing up in this cycle. Since we started this year, the overwhelming consensus view by investors is that a recession in the first and second quarters would likely force the Fed to pivot its rate policy by August. While we agree with the risks of a precipitous economic downturn on the horizon, the risk of inflation re-emerging during that downturn has been completely ignored.
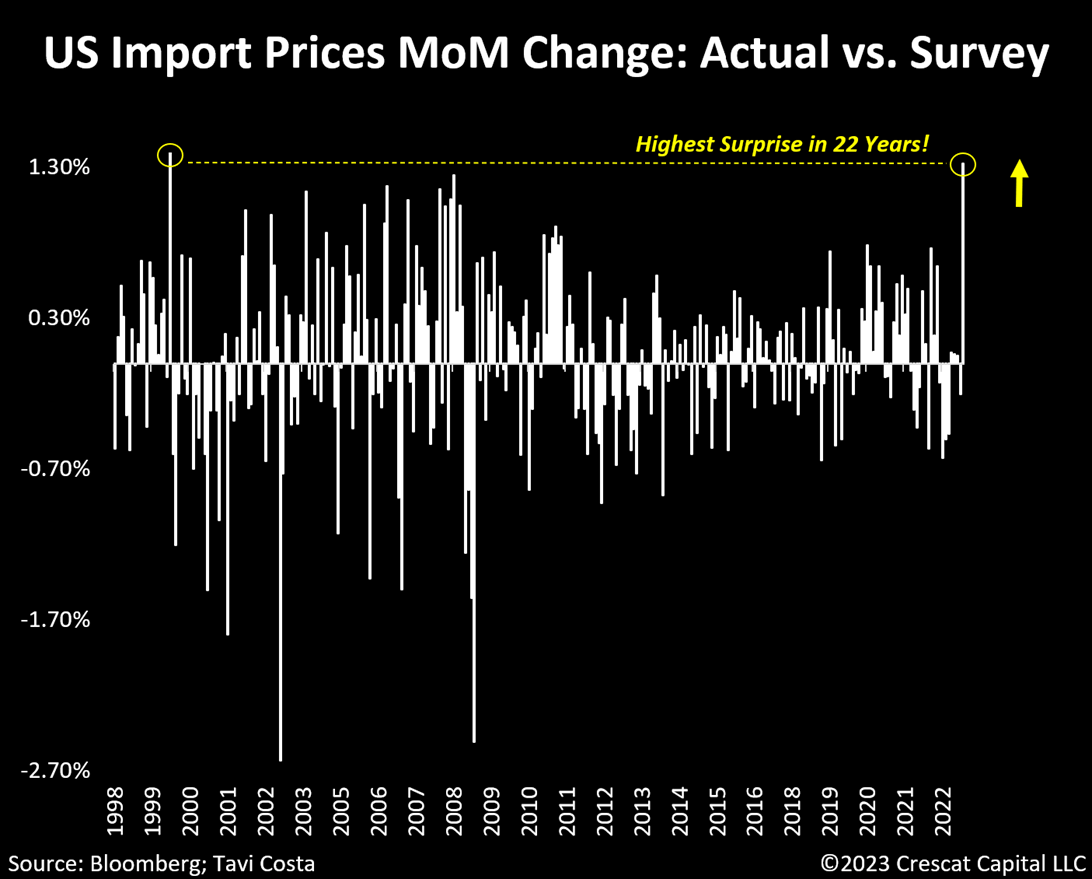
5. Deglobalization: Geopolitical divisions between Eastern authoritarian and Western democratic countries and the Russia/Ukraine war are leading to long-term re-alignment of trade dependencies that we refer to as deglobalization. Deglobalization of course is also the key driver of Western onshoring and our US manufacturing revitalization theme. While geopolitical tensions will ebb and flow, and global trade between East and West will continue, a secular deglobalization trend has already been set in motion, and the U.S. should continue higher “import-cost” driven inflation as a result. Along with a retreat in the dollar recently, US import prices just registered their highest upward surprise on a month-over-month basis in 22 years.
Commodity Prices Hold the Key
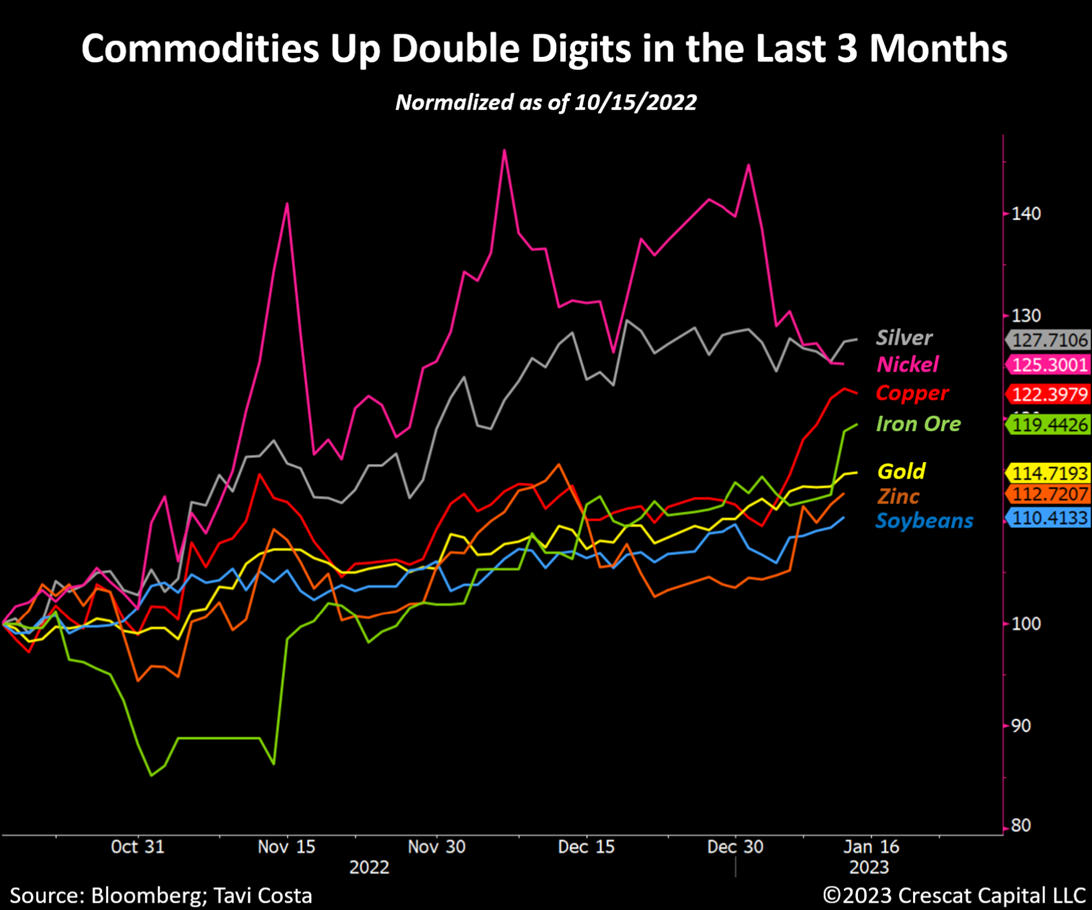
It should not be too hard for people to see that if commodity prices started taking off again to the upside in the short run, then CPI could see another surge during this wave. Steep moves in commodity prices often lead to a ripple effect among natural resources. Recently, gold was the first one to break out, then silver followed, copper was next, and now we have a list of other commodities already up double digits in the last three months. This is starting to become contagious. We believe that energy and agricultural commodities are likely to be next.
The global supply of oil and gas remains incredibly tight and ripe for a strong upward move in prices. Energy stocks are highly favored in our fundamental equity model and a significant long exposure in our Global Macro, Long Short, and Large Cap strategies. Commodities and value-oriented equities in the energy, materials, and industrial sectors represent one of the best hedges to popular but still-overvalued growth equities and fixed-income securities.
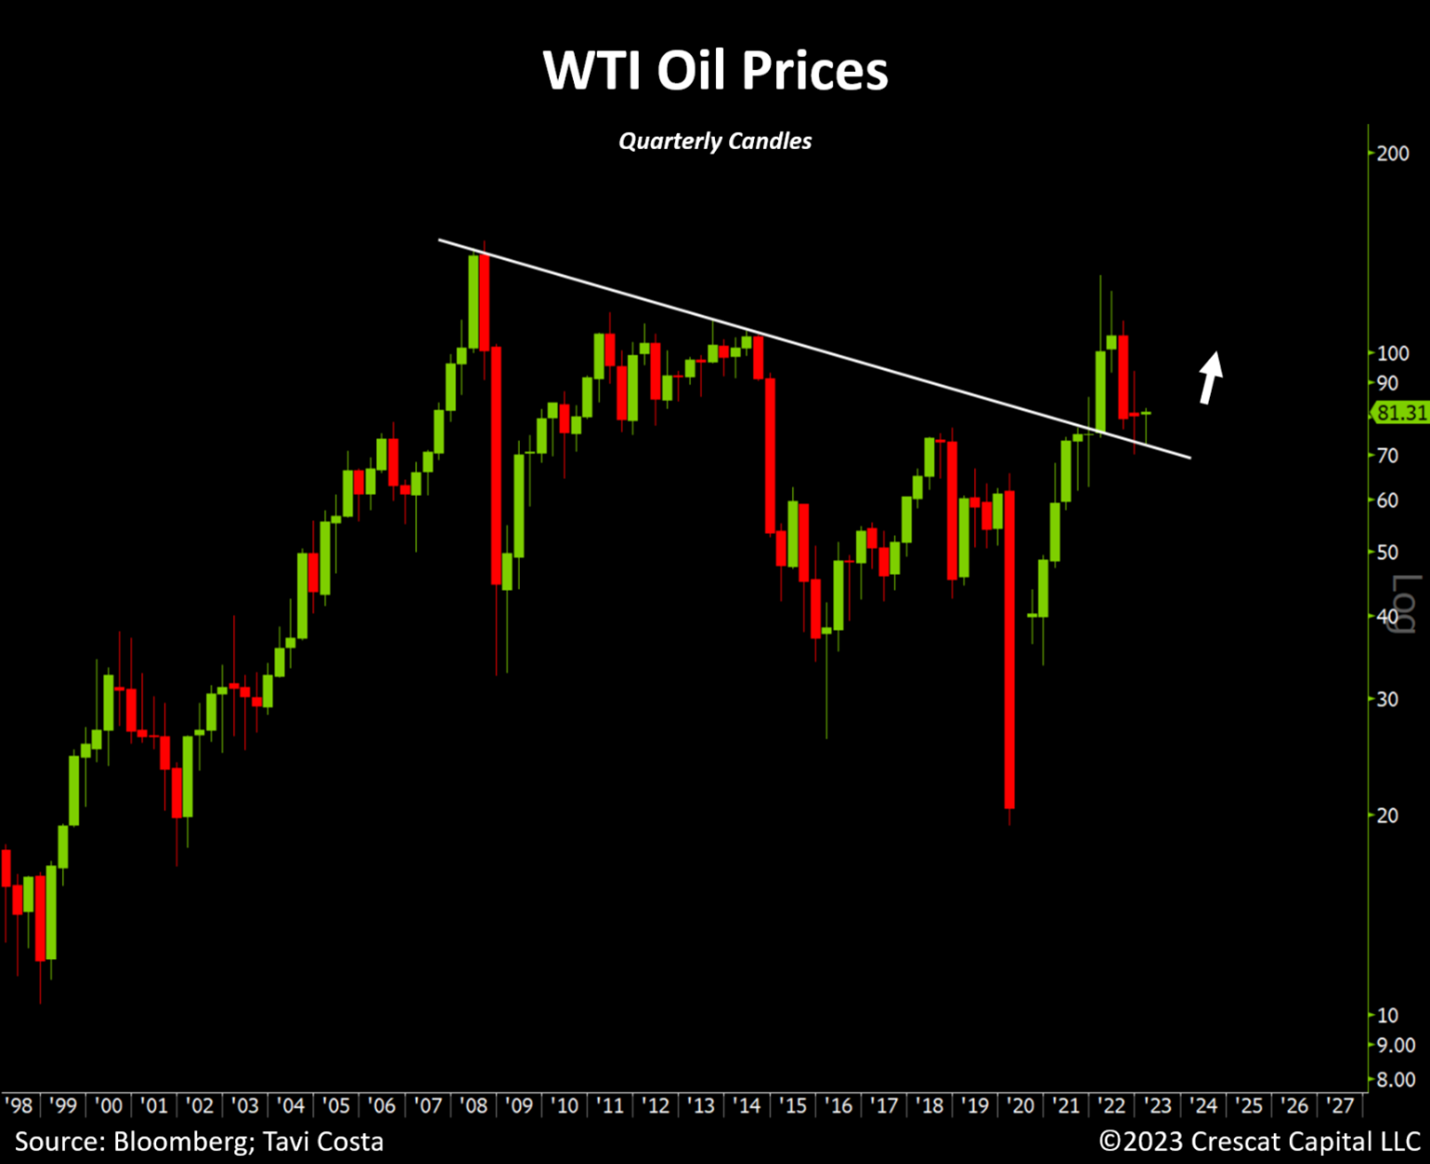
This long-term technical setup in WTI crude is one of the most compelling charts in today’s macro environment. It begs the question, what if oil prices have another big move up, inflation re-accelerates, and interest rates need to stay higher for longer? We would expect to see much more compression in financial asset valuations.
A Falling Wedge
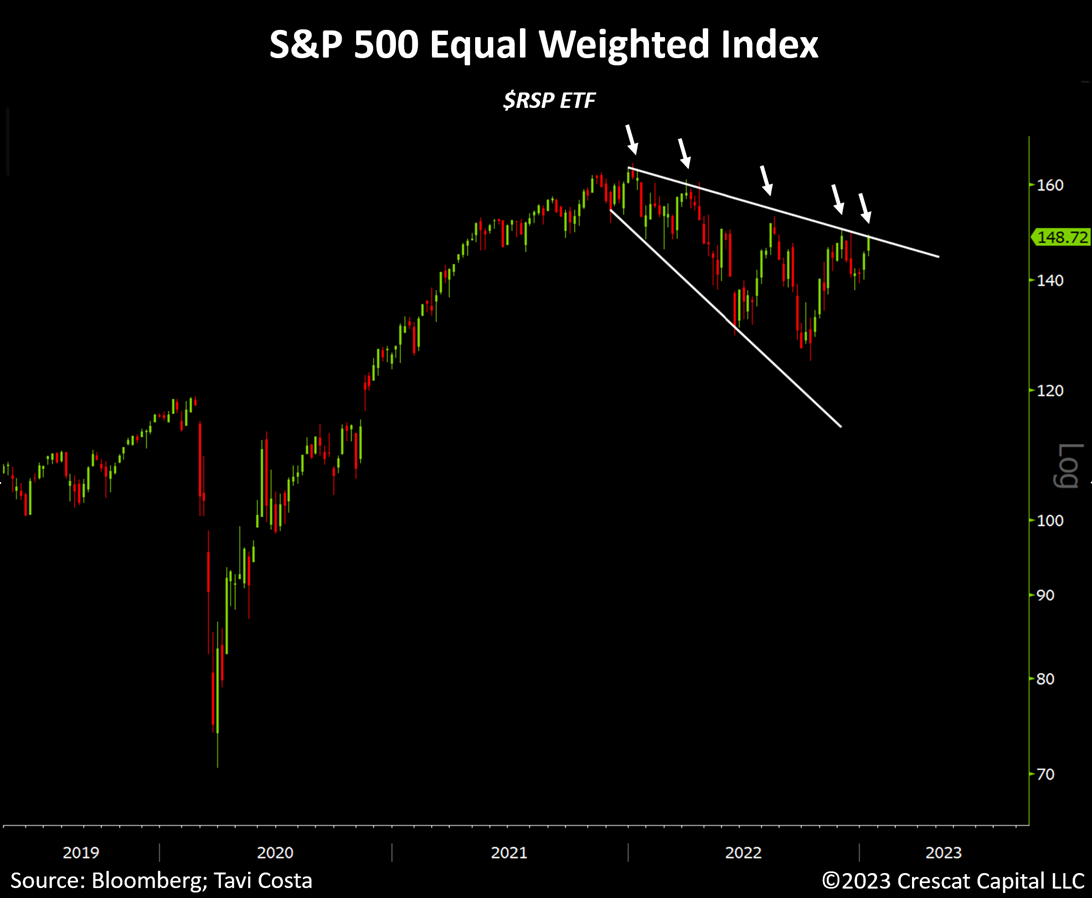
If technical setups matter, US equity markets are again at a critical juncture. The S&P 500 equal-weighted index is back to the upper band of a falling wedge, and it is likely to face strong price resistance to resume its downward trend. While this formation attracts us from a short-term positioning standpoint, we put a much larger emphasis on our macro and fundamental views. The overall US equity market remains historically expensive based on multiple fundamental metrics at a time when global central banks continue to severely withdraw liquidity from financial markets. Let us not forget that monetary tightening also works with a lag with respect to the deterioration of corporate fundamentals and the destruction of financial asset values.
Our Largest Individual Short Position
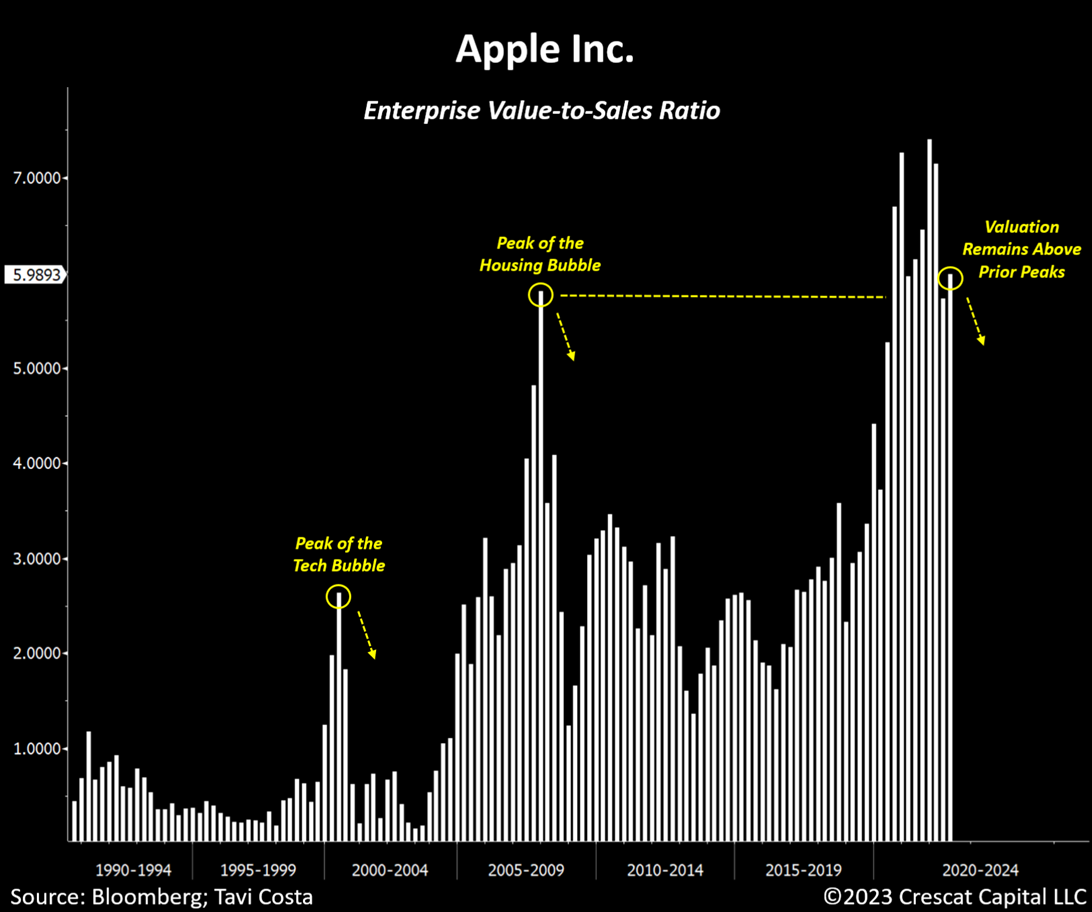
Despite the recent decline in Apple’s prices, the valuation of the stock remains extremely overvalued. As shown in the chart below, its enterprise value-to-sales ratio is twice the level reached at the peak of the Tech Bubble, and slightly more expensive than it was at the peak of the Housing Bubble. With most of the “FAANG darlings” already re-testing their March 2020 lows, we believe this is a painful roadmap for Apple still ahead. One year ago, it was unimaginable for most investors to think that Amazon, one of the most crowded positions at the time, would be trading 50% lower from its highs.
Apple is likely on the same path. It is a consumer discretionary business that is still trading at 22 times next year’s earnings as the economy enters a steep recession. We think Apple’s fundamentals are highly inflated and likely to deteriorate significantly as the current economic downturn continues to develop. With the current deglobalization trends intensifying, the era of cheap labor is over and, in our view, today’s optimism towards Apple needs to be severely re-priced. This is currently the largest individual short position in our Global Macro and Long Short funds.
Major Liquidity Withdrawal
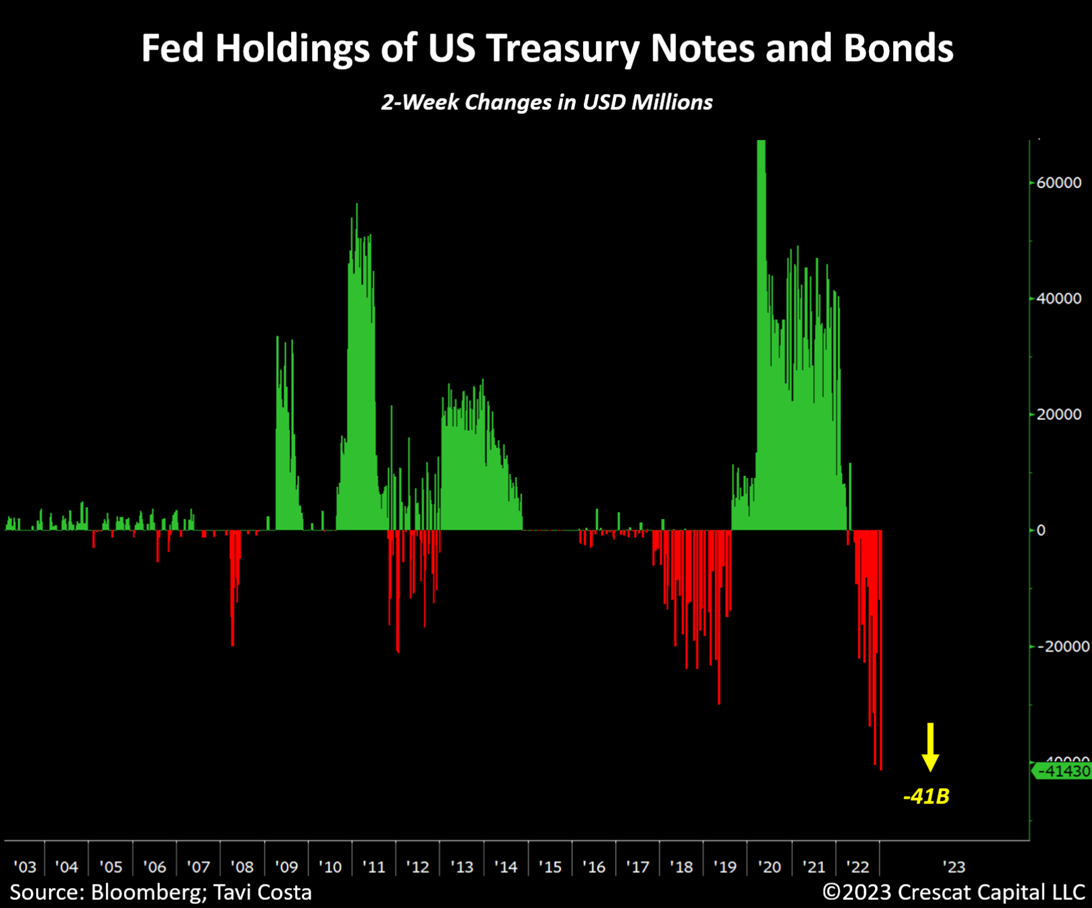
For market liquidity purposes, the decline in the Fed’s balance sheet assets is arguably even more relevant than the hiking interest rates cycle. On a two-week change basis, the Fed holdings of US Treasury notes and bonds just fell by the largest amount in history. The drop was equivalent to $44 billion.
Fed’s Own Indicator of Economic Activity Still on the Rise
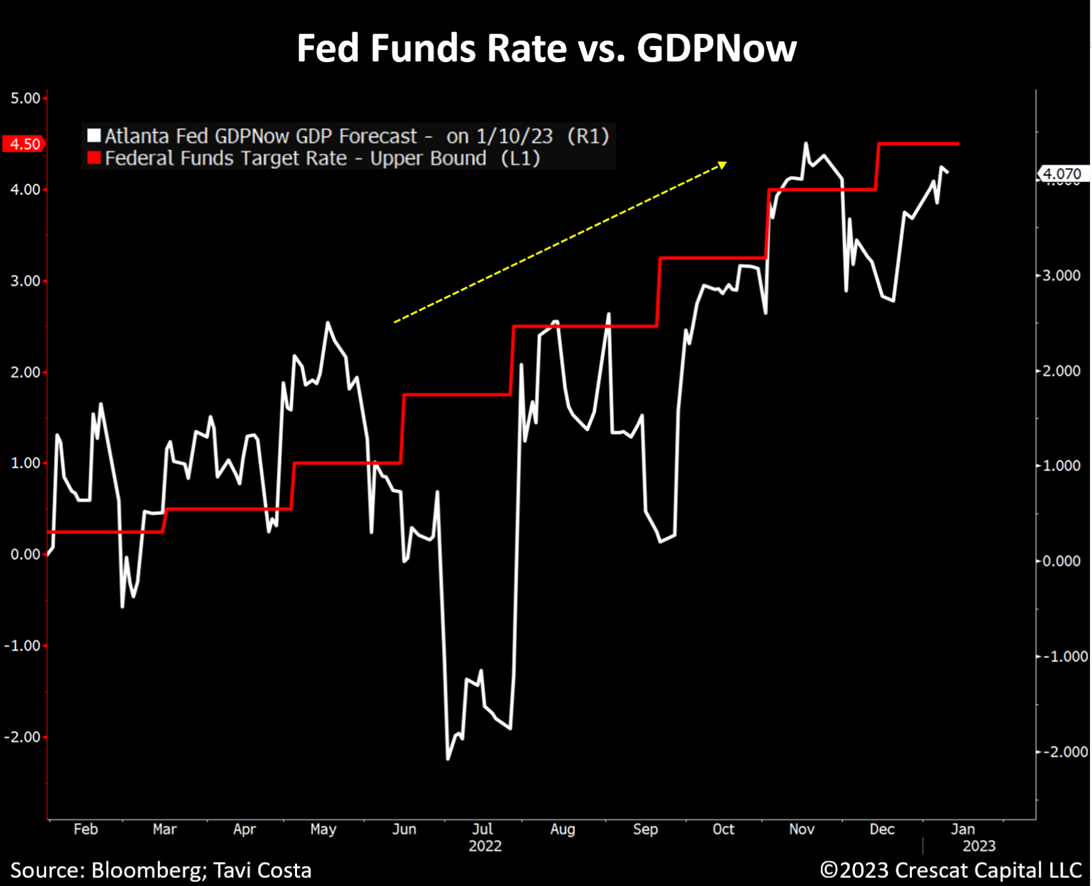
The Fed’s job of hiking interest rates is not as close to an end as markets believe it could be. While rates have significantly moved higher over the last year, the Fed’s own measurement of economic activity continues to accelerate in tandem. In our view, investors are miscalculating the risk of policy makers staying hawkish for longer.
Energy Sector
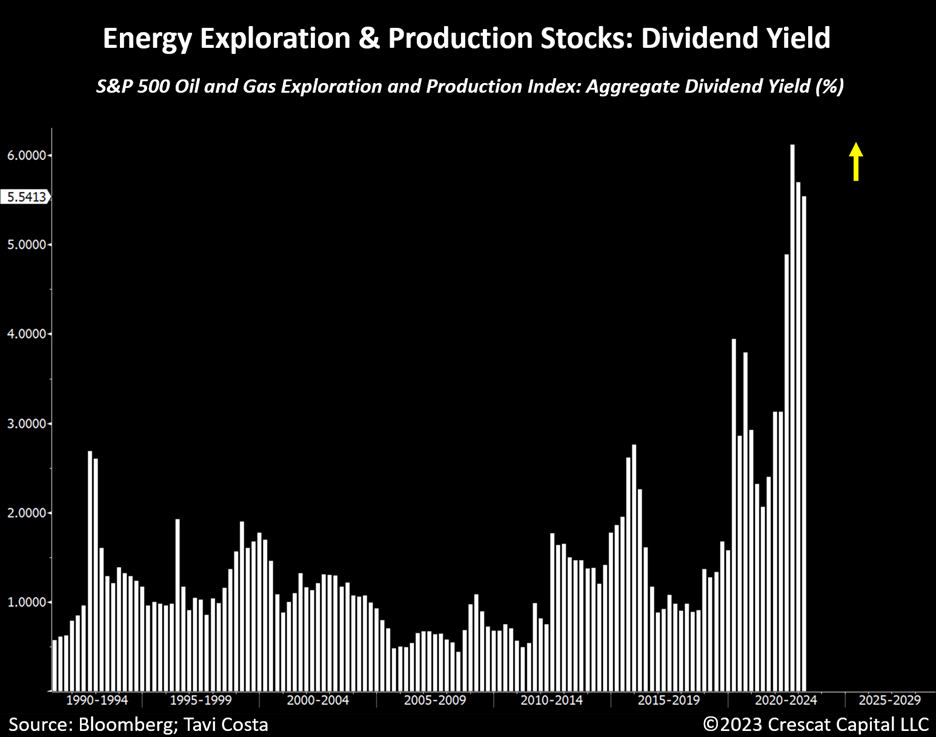
Oil and gas stocks just had their two best annual performances in 30 plus years, and the sector still trades at one of the cheapest levels in history. Aggregate free-cash-flow yield for energy exploration and production companies is now at 11%.
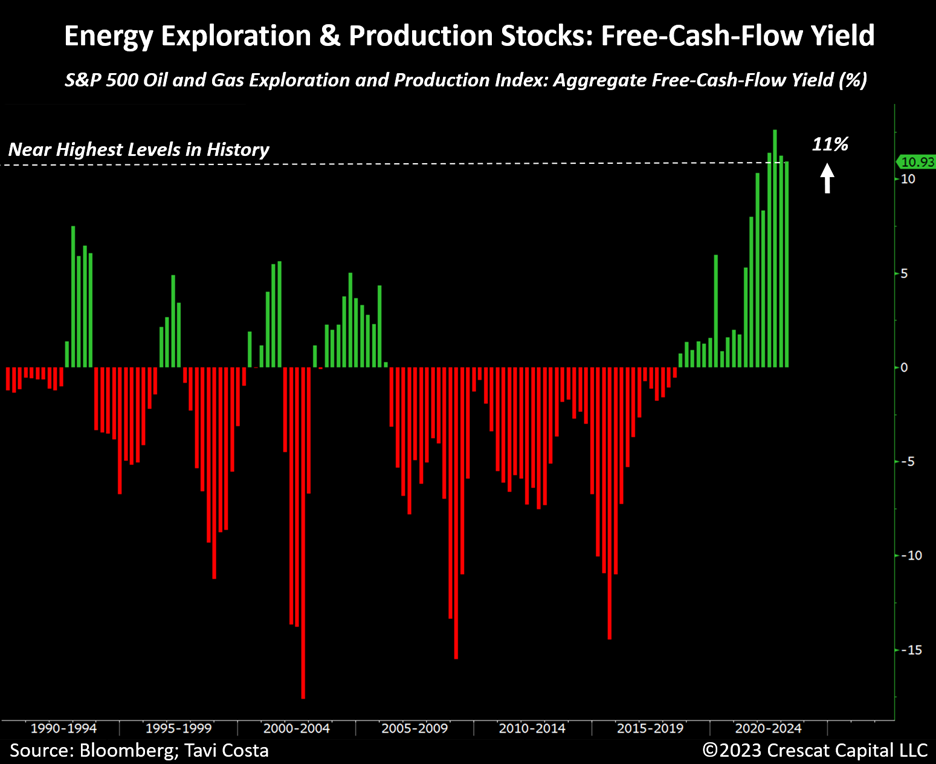
Oil and gas exploration and production companies are by far paying their highest dividend yield in the history of the data.
Buy Gold and Sell Stocks
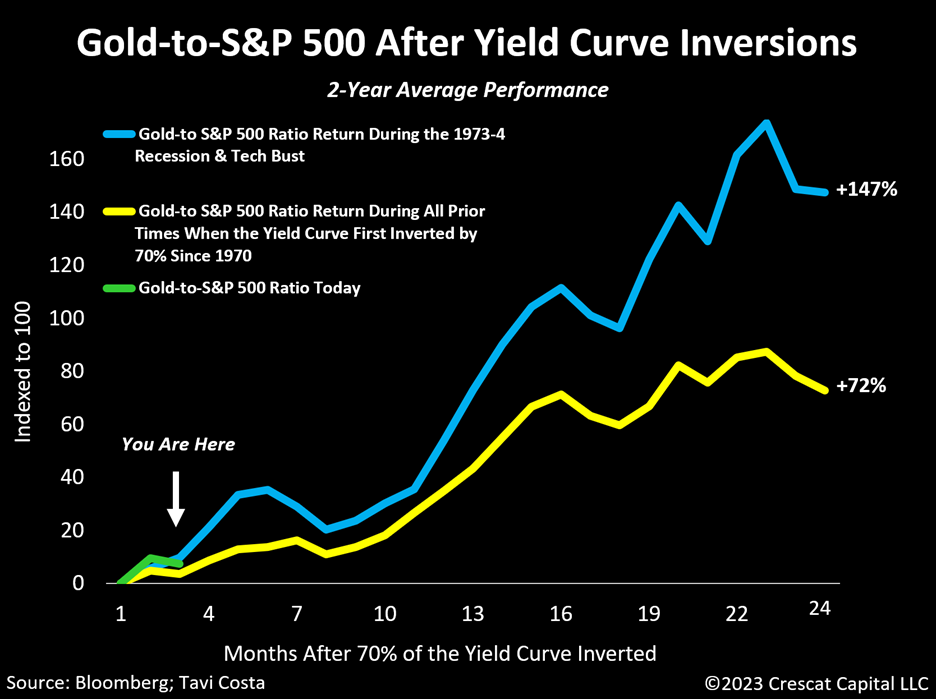
Since November, when the percentage of yield curve inversions in the Treasury curve shot up above 70%, the gold-to-S&P 500 ratio has performed incredibly well. As we have extensively laid out in prior letters, precious metals tend to substantially outperform overall equity markets after the number of all possible spreads among US interest rates becomes as excessively inverted as it is today. Just like we saw during the 1973-4 stagflationary crisis and the tech bust, we believe there is an exceptionally strong fundamental and macro case for both legs of this trade to work well in the coming months.
The blue line in the chart below shows the average outstanding performance of the gold-to-S&P 500 ratio during those two recessionary periods, up 147% in two years after yield curve inversions crossed the 70% threshold. Today’s signal was triggered only two months ago, and the same ratio is already on record for a strong start. We believe this is just the beginning of a long-term trend that should benefit not only precious metals but also mining stocks that present a true deep-value opportunity at their current prices, particularly high-quality exploration businesses.
Precious Metals Highly Attractive
The recent cyclical downshift in inflation expectations has created an opportunistic time for investors to position for the next leg up in commodities prices, particularly precious metals.
One area that shows clearly how investors are not positioned for an inflationary recession is the lack of generalist interest in precious metals exploration. Looking at the dollar volume traded on Canada’s TSX Venture Exchange which is dominated by gold, silver, and base metal explorers and developers is perhaps the best way to see this.
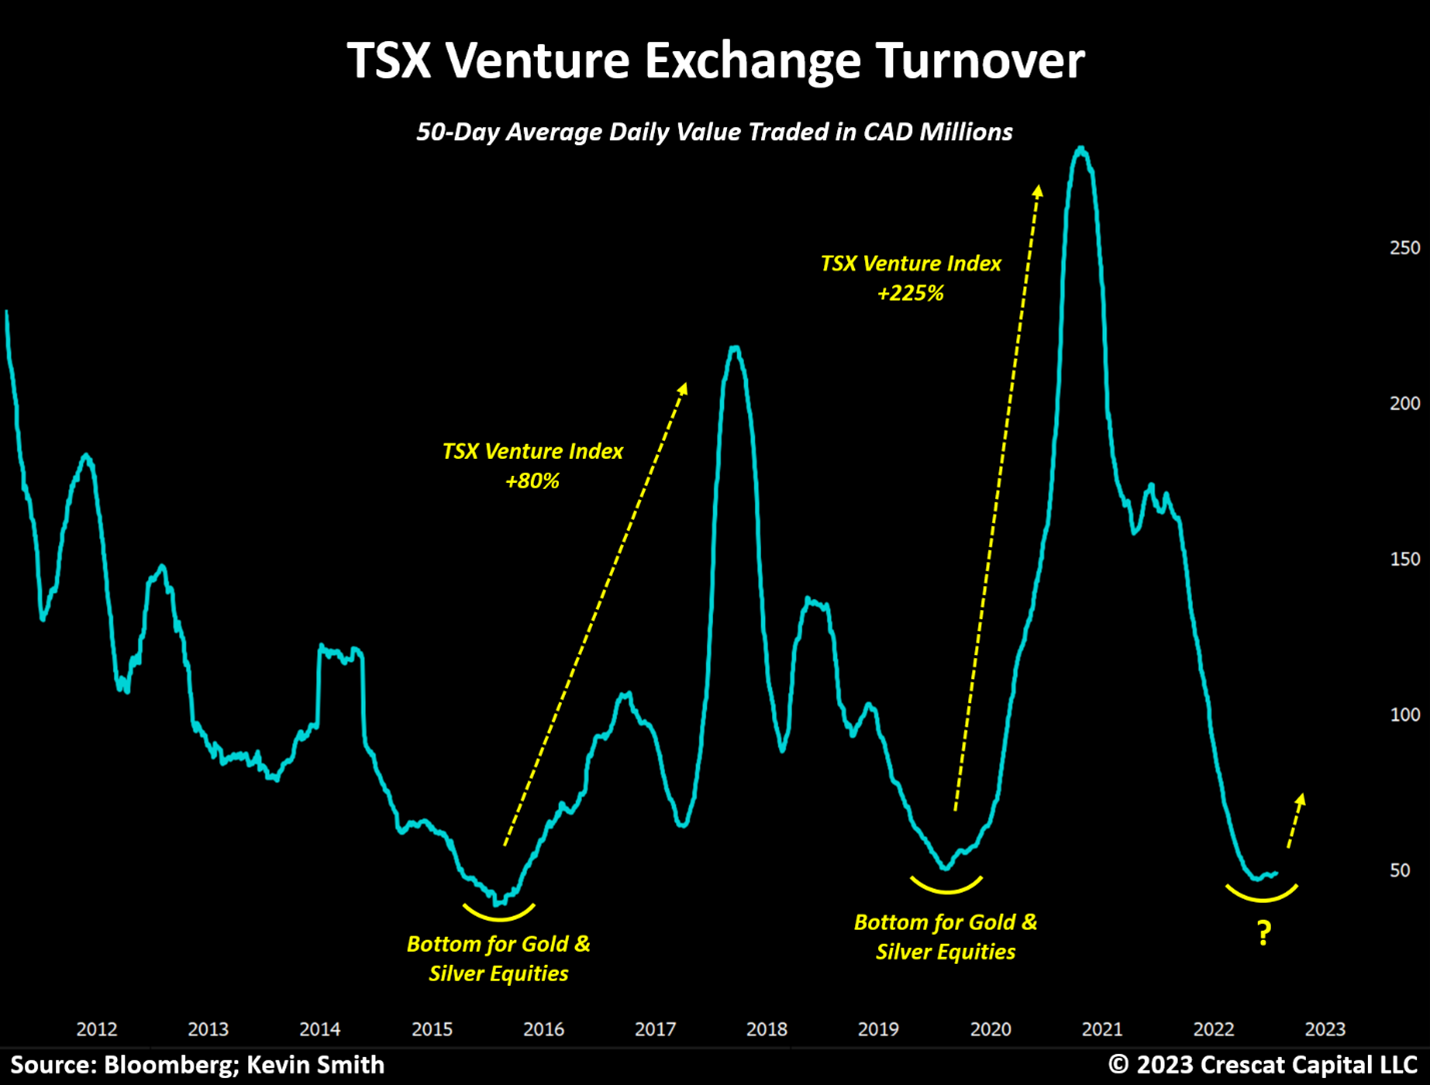
The money flow interested in exploration stocks has been shrinking for two years and has remained unusually depressed for the last seven months. For us, the last two years have been an incredible opportunity to put money to work in deeply undervalued explorers. We have built substantial activist positions in over 60 companies largely through PIPE deals to help these firms build hundreds of millions of target gold-equivalent ounces through the drill bit.
Our companies have generated numerous new and impending large, high-grade metal discoveries. We have acquired an enormous quantity of ultra-cheap metal in the ground for less than a penny on the dollar relative to our discounted expected deposit sizes. The exploration segment of the mining industry, going by the TSX-V turnover in the chart above, looks like a coiled spring to us. In a bull market, stocks with bona fide discoveries can trade up to 20 cents on the dollar relative to the expected size of the deposit.
Imagine how our explorers will perform under rising inflation expectations, rising metals prices, and as the 50-day TSX-V average daily trading value goes from a depressed C$50 million to C$250 million and higher as it has in the past. A variety of metal prices have already started to perk up in the last few months, and so have the large and mid-cap producers, i.e., the stocks in the GDX and GDXJ. The small-cap explorers and developers have lagged, as the chart above illustrates, but we think not for much longer. We are confident that the gains in the exploration stocks are poised to catch up and exceed these benchmarks, especially our expertly crafted portfolio of them thanks to Quinton T. Hennigh, Ph.D., Crescat’s geologic and technical director.
Crescat’s 2022 Performance Attribution by Theme
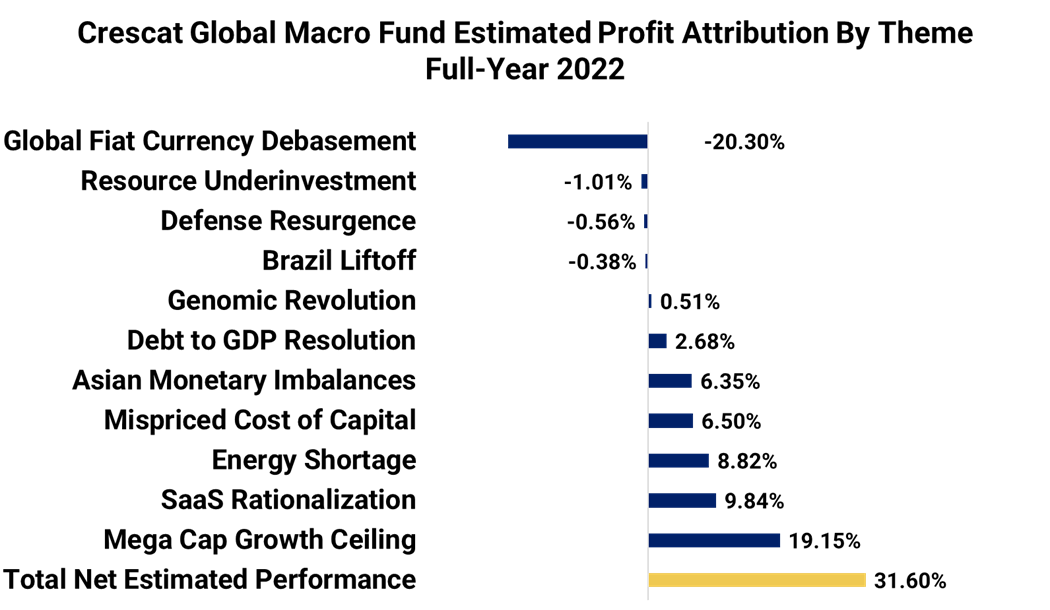
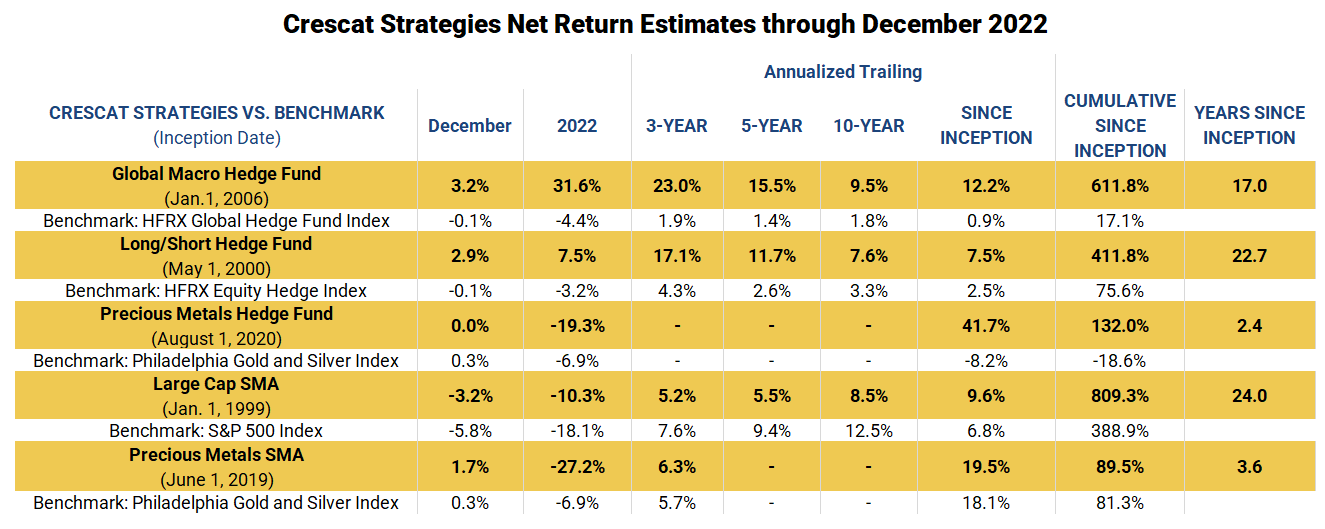
Crescat’s Global Macro and Long/Short funds finished 2022 strong in a down market for stocks and bonds. Positive performance in each of these funds was driven by a broad variety of short-related macro themes with security selection supported by the firm’s macro and fundamental equity models.
Megacap Growth Ceiling, SaaS Rationalization, and Mispriced Cost of Capital were predominantly equity-related short themes that worked well for both the Global Macro and Long/Short funds.
China Currency Devaluation and Debt-to-GDP Resolution were short exposures in the currency and fixed-income markets that delivered positive performance on top of the above themes for the Global Macro fund.
Energy Shortage was the one predominantly long-exposed theme that delivered positive performance for both the Global Macro and Long/Short funds.
The biggest detractor firmwide in 2022 was the Global Fiat Debasement theme, which is the firm’s predominantly long-biased exposure in the precious metals markets. We launched a friendly activist fund, the Crescat Precious Metals Fund, focused on this theme two and a half years ago. This fund has been extremely successful since inception, up 132.0% versus a negative total return of 18.6% for the benchmark Philadelphia Gold and Silver Index.
While the Precious Metals fund was down in 2022, we view it as merely a pullback and a deeply undervalued buying opportunity still early in a secular bull market. We are encouraged by the macro setup for precious metals in 2023 on both the supply and demand side of the market. Demand factors include increased global central bank buying and investor long-term inflation expectations that are unrealistically depressed and due to turn back up.
On the supply side, declining production worldwide is baked in based on historic underinvestment.
On that front, we are especially optimistic about the outlook for our exploration-focused companies after a decade of underinvestment by major and mid-tier miners industry-wide. Our metals portfolio is focused predominantly on firms that possess large new and incipient gold, silver, and copper discoveries worldwide in large part due to Crescat’s infusion of capital and aggressive activist drilling campaign ahead of a likely M&A cycle. These may be small and micro-cap companies, but they are building enormous new gold, silver, and copper resources. We believe our exploration portfolio is extraordinarily undervalued.
Performance Estimates Through December 2022
Sincerely,
Kevin C. Smith, CFA
Member & Chief Investment Officer
Tavi Costa
Member & Portfolio Manager
For more information including how to invest, please contact:
Marek Iwahashi
Client Service Associate
303-271-9997
Cassie Fischer
Client Service Associate
cfischer@crescat.net
(303) 350-4000
Linda Carleu Smith, CPA
Member & COO
(303) 228-7371
© 2023 Crescat Capital LLC
Important Disclosures
Performance data represents past performance, and past performance does not guarantee future results. An individual investor’s results may vary due to the timing of capital transactions. Performance for all strategies is expressed in U.S. dollars. Cash returns are included in the total account and are not detailed separately. Investment results shown are for taxable and tax-exempt clients and include the reinvestment of dividends, interest, capital gains, and other earnings. Any possible tax liabilities incurred by the taxable accounts have not been reflected in the net performance. Performance is compared to an index, however, the volatility of an index varies greatly and investments cannot be made directly in an index. Market conditions vary from year to year and can result in a decline in market value due to material market or economic conditions. There should be no expectation that any strategy will be profitable or provide a specified return. Case studies are included for informational purposes only and are provided as a general overview of our general investment process, and not as indicative of any investment experience. There is no guarantee that the case studies discussed here are completely representative of our strategies or of the entirety of our investments, and we reserve the right to use or modify some or all of the methodologies mentioned herein.
Separately Managed Account (SMA) disclosures: The Crescat Large Cap Composite and Crescat Precious Metals Composite include all accounts that are managed according to those respective strategies over which the manager has full discretion. SMA composite performance results are time-weighted net of all investment management fees and trading costs including commissions and non-recoverable withholding taxes. Investment management fees are described in Crescat’s Form ADV 2A. The manager for the Crescat Large Cap strategy invests predominantly in equities of the top 1,000 U.S. listed stocks weighted by market capitalization. The manager for the Crescat Precious Metals strategy invests predominantly in a global all-cap universe of precious metals mining stocks.
Hedge Fund disclosures: Only accredited investors and qualified clients will be admitted as limited partners to a Crescat hedge fund. For natural persons, investors must meet SEC requirements including minimum annual income or net worth thresholds. Crescat’s hedge funds are being offered in reliance on an exemption from the registration requirements of the Securities Act of 1933 and are not required to comply with specific disclosure requirements that apply to registration under the Securities Act. The SEC has not passed upon the merits of or given its approval to Crescat’s hedge funds, the terms of the offering, or the accuracy or completeness of any offering materials. A registration statement has not been filed for any Crescat hedge fund with the SEC. Limited partner interests in the Crescat hedge funds are subject to legal restrictions on transfer and resale. Investors should not assume they will be able to resell their securities. Investing in securities involves risk. Investors should be able to bear the loss of their investment. Investments in Crescat’s hedge funds are not subject to the protections of the Investment Company Act of 1940. Performance data is subject to revision following each monthly reconciliation and annual audit. Current performance may be lower or higher than the performance data presented. The performance of Crescat’s hedge funds may not be directly comparable to the performance of other private or registered funds. Hedge funds may involve complex tax strategies and there may be delays in distribution tax information to investors.
Investors may obtain the most current performance data, private offering memoranda for Crescat’s hedge funds, and information on Crescat’s SMA strategies, including Form ADV Part II, by contacting Linda Smith at (303) 271-9997 or by sending a request via email to lsmith@crescat.net. See the private offering memorandum for each Crescat hedge fund for complete information and risk factors.