The last 12 months have marked one of the steepest Fed rate-hiking cycles in history. Meanwhile, financial conditions remain too loose for secular inflationary forces but too tight for financial assets near record valuations. If this is the beginning of another multi-year period of higher-than-average cost of capital, overall equity markets are yet to reflect these changes in fundamental multiples.
Since 1900, there have been only five decades that the total real return for US stocks was negative. In fact, they were all deeply negative. Three of these periods happened during inflationary eras. The other two occurred at a time when valuations of US equity markets were at historical levels. Today, we have both setups at the same time.
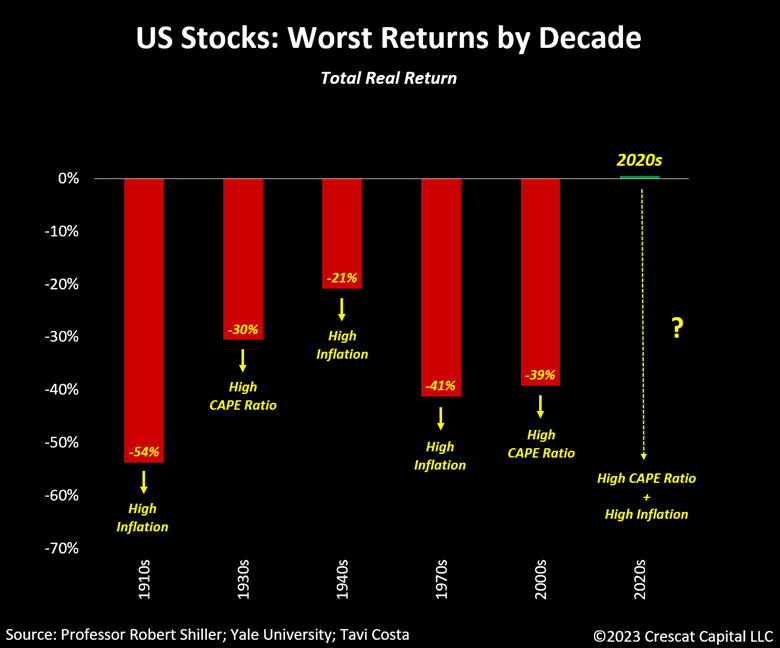
Multiple Compression During Inflationary Eras
Most investors have been conditioned to value financial assets as if they were about to experience another disinflationary decade. As shown in the chart above, the last time we had a long period of higher-than-average cost of capital was in the 1910s, 1940s, and 1970s. While each had its own unique circumstances, fundamental multiples for stocks significantly contracted over all those decades. To be specific, the average decline was nearly 50%. More importantly, note that CAPE ratios shrunk to single digits at the end of two periods and to just 10.5x in the 1940s.
What if today’s multiples were to reach similar levels by the end of this decade?
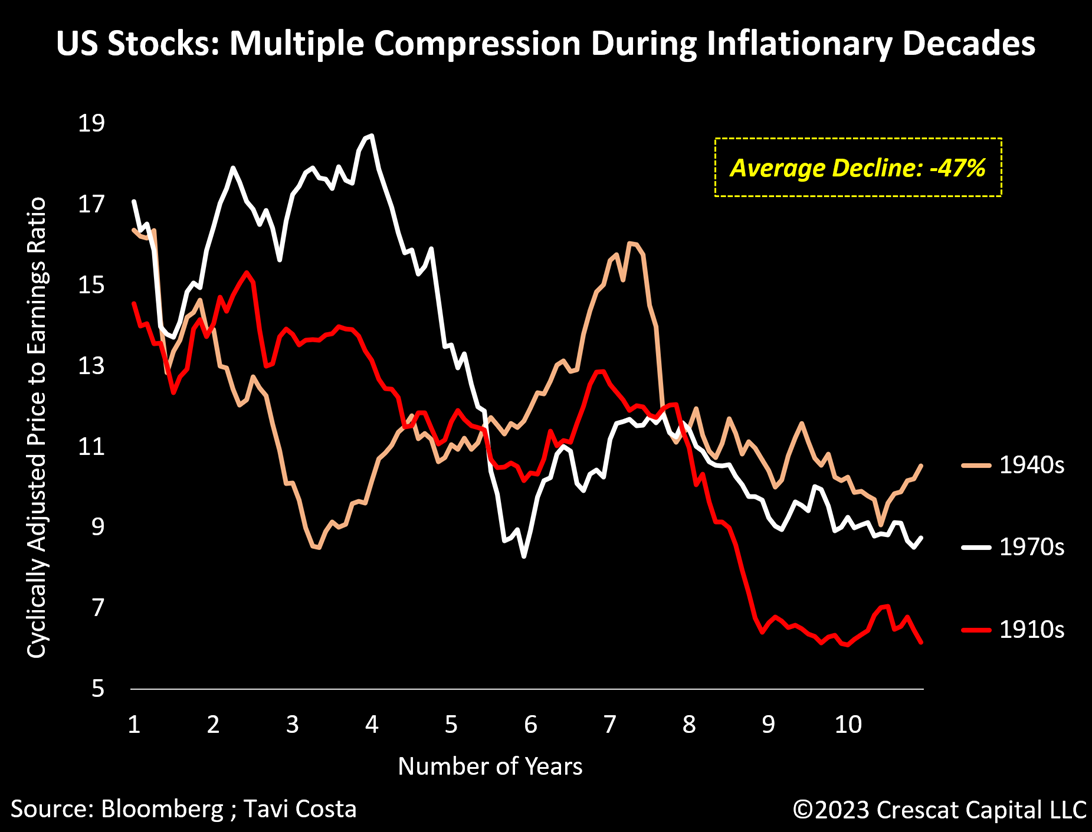
Equity Multiples During Inflationary Decades
The last decade, the 2010s, marked one of the best times for corporate profit growth in the last century. By the end of that period, 10-year cyclically adjusted earnings had grown by 61%. If we were to experience the same robust increase this time around, assuming a 10.5x CAPE ratio, the S&P 500 would be trading 55% lower by the end of this decade.
While this may sound extreme to some, what if we use a 15x CAPE instead? That would take the S&P 500 about 34% lower than its current prices.
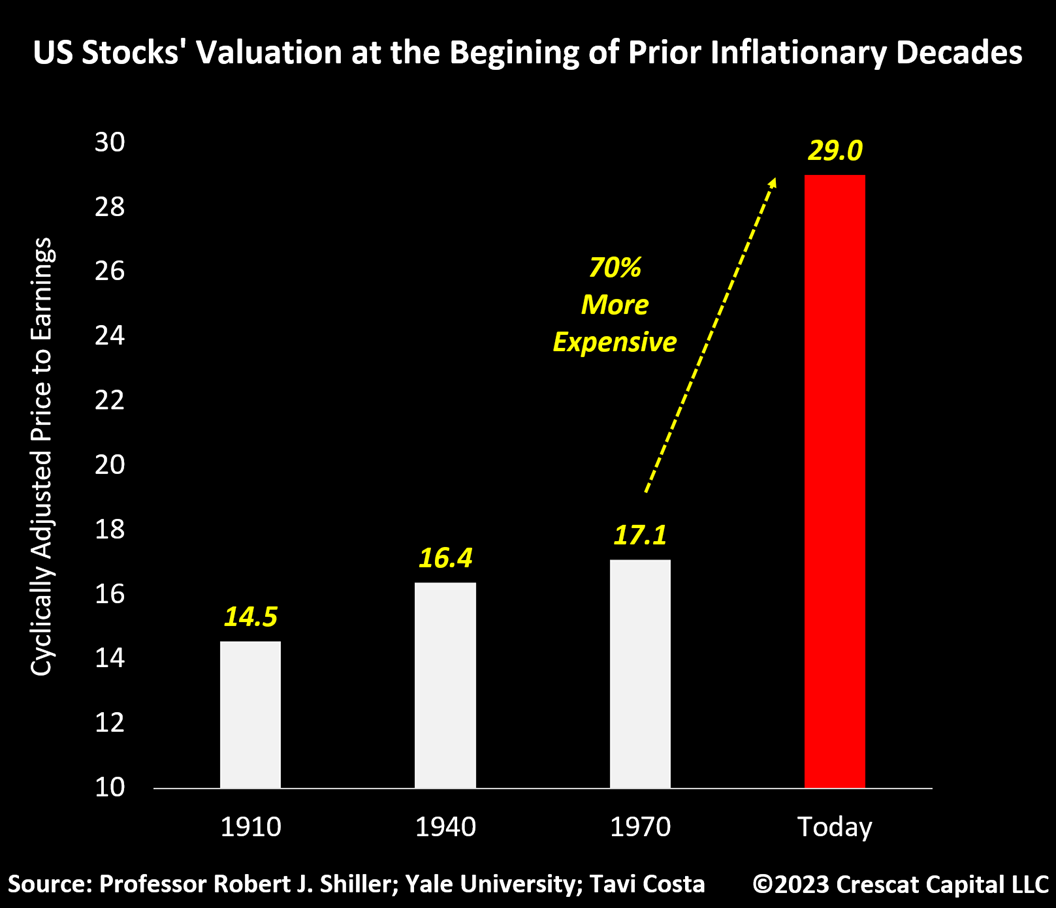
OK, what if we apply the corporate earnings growth rate that occurred during inflationary decades instead? Using professor Robert Shiller’s data, the average increase in the 10-yr cyclically adjusted earnings was close to 16% from the beginning to the end of those periods. In that case, assuming a 10.5x CAPE ratio again, US stocks would be down approximately 67%. Alternatively, using a 15x multiple, equity markets could be down as much as 52%. While these declines may seem excessive, they are simply a function of historic multiples in a high cost of capital environment like today and represent the downside risk in the market. Additionally, today’s valuations are over 70% more expensive than they were when each of those inflationary decades began.
A 70-Year Channel in Corporate Earnings
To be clear, these scenarios did not consider the potential impact of a decline in corporate earnings. What if the pressure from rising labor costs becomes structural, causing margins to compress from record levels while almost every analyst on Wall Street expects profits to grow at double digits for the next couple of years?
Nominal corporate earnings have been trending in an upward channel for 70 years. Every time profits reached the upper band of this range, an earnings recession followed. In one case, their aggregate earnings per share declined by over 42%. We are at a similar peak-level juncture again today while analysts continue to be overly optimistic.
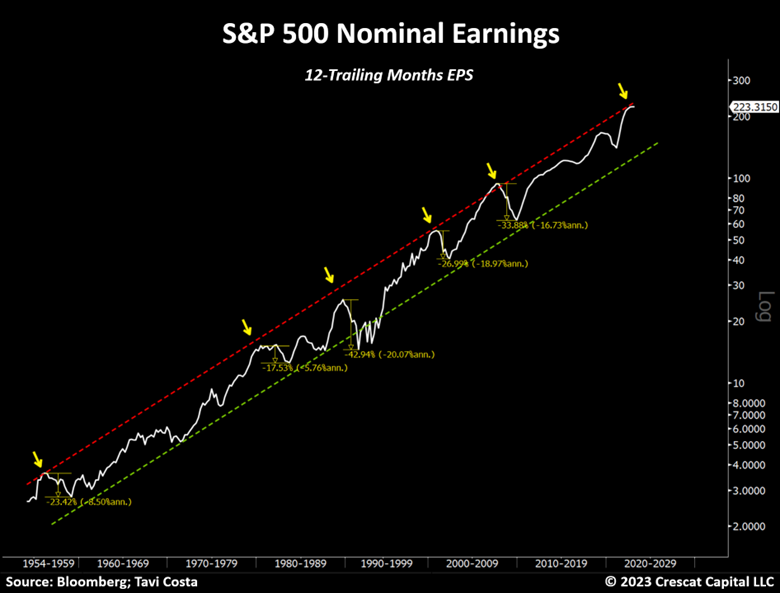
Peak Earnings
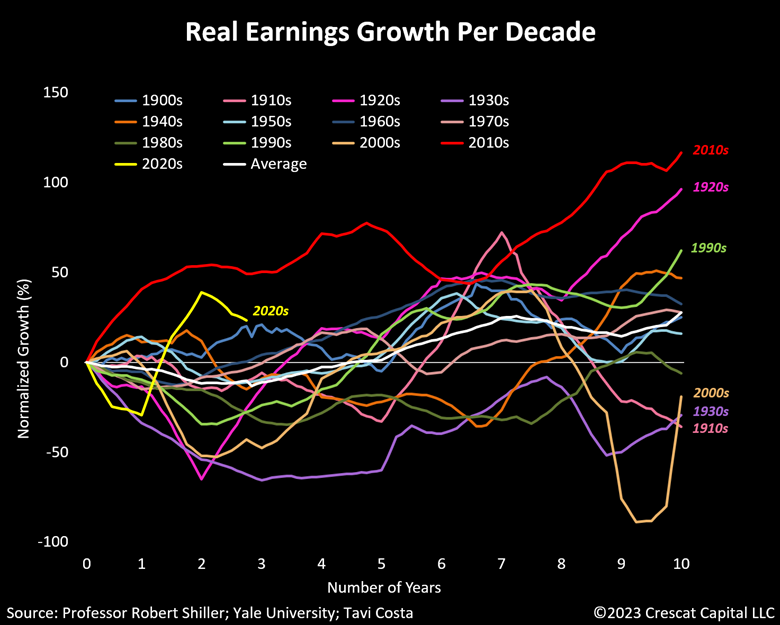
When adjusting corporate fundamentals to inflation levels, the current real growth in earnings for this decade is on pace for being the second largest in history, which is right behind the prior decade’s performance. Note that outside of the 2010s, the other two times we had outstanding long-term increases in profits were in the 1920s and the 1990s. Both periods preceded severe earnings recessions. We believe the 2010s marked another decade’s peak for corporate profits and today’s growth is completely unsustainable. Earnings are poised to turn negative over the next year and likely for the balance of the decade due to structural inflationary factors.
Our work shows that corporate margins are likely to be drastically reduced by a combination of key macro forces: an early-stage wage-price spiral, higher cost of capital, rising deglobalization trends, and a continuation of structurally rising material costs.
Corporate Earnings During Inflationary Decades
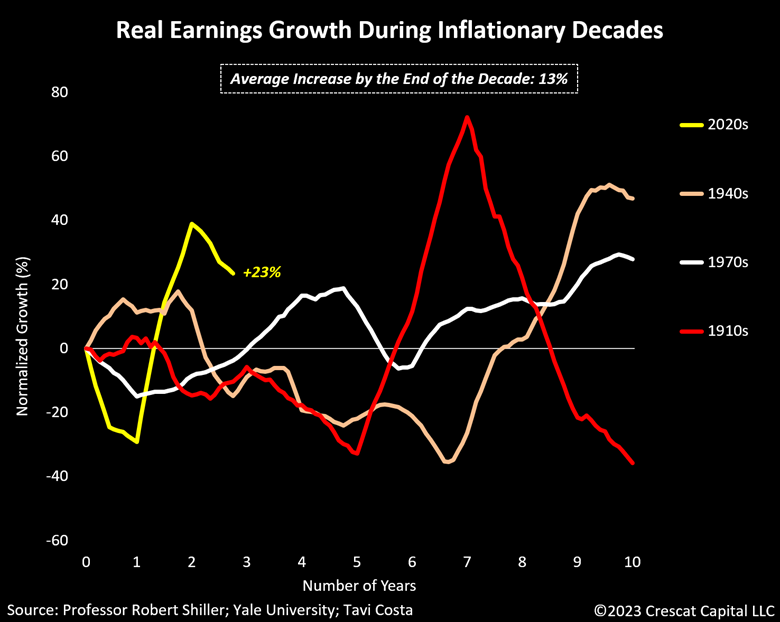
However, despite the risk of a cyclical downturn in profits, it is important to point out that, even in real terms, corporate earnings increased on average by 13% during inflationary decades. More notably, these periods were extremely volatile for profits.
The issue today is that we are two years into the decade where real corporate earnings have already grown by 23% with companies achieving their highest profit margins in history, the lagged product of unprecedented monetary stimulus that has been reversed.
Valuations Matter
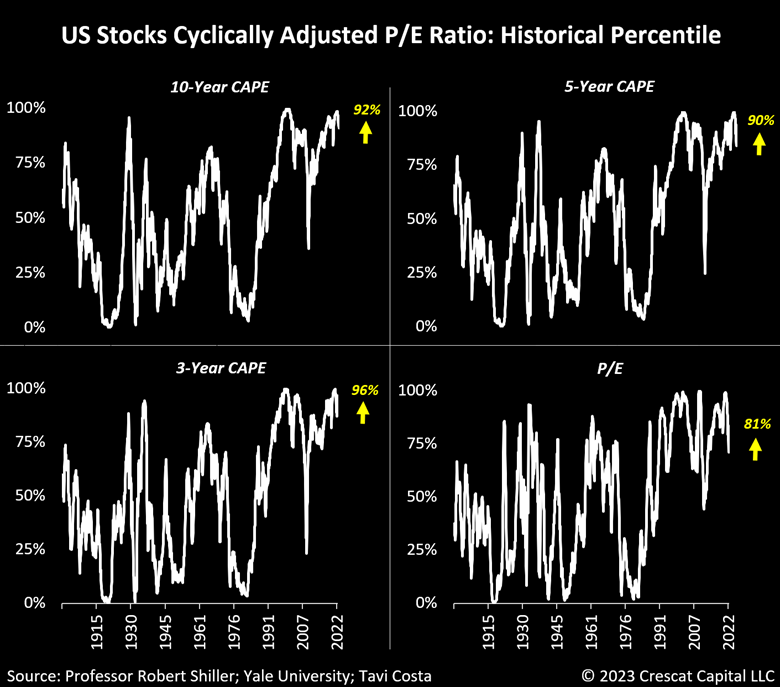
In our analysis, the broad stock market outside of natural resource industries is historically expensive on almost all fundamental metrics. It is one of the main reasons why the start of this decade is so unique, especially compared to the 1970s when equities were substantially cheaper at the beginning.
On a CAPE ratio basis, for instance, market prices are near record levels relative to 1, 3, 5, and 10-year cyclically adjusted earnings. The only plausible way to justify the current multiples in equity markets would be if, for the first time in history, we were to experience a 50% increase in real earnings for back-to-back decades. However, every prior speculative environment like we have today ended with significant real earnings and economic contraction. With the monetary liquidity that drove this mania having been sharply reversed, it is hard to make a compelling case why this time will be different.
Megacap Tech Still in a Bubble
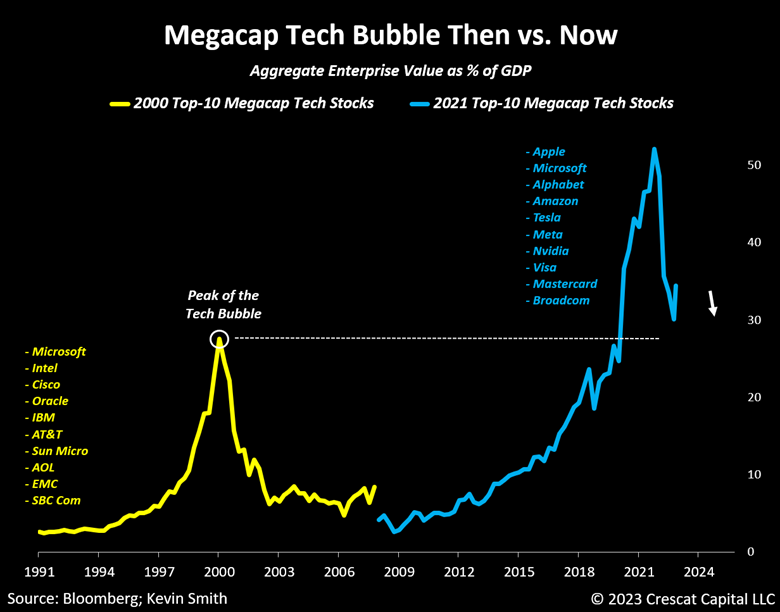
Valuations for the top-ten megacap tech stocks are still higher than they were for their comps at the peak of the tech bubble. Enterprise Value to GDP is the relevant measure here because once the underlying fundamentals for a group of companies have grown so large relative to the economy, as it has for these firms, then collectively, these companies can no longer grow any faster than the economy at large. They essentially are the economy. And when the fundamentals for these businesses start to turn negative yet these enterprises are still valued as if they will grow many times faster than GDP, then it is a mania whose unwinding can lead the entire economy into a recession.
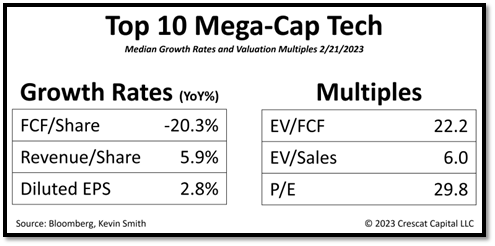
Median free cash flow per share growth for today’s former leaders has in fact already turned negative on a year-over-year basis just like their comps did in 2000 and 2001, down 20.3%. Median free cash flow per share growth turned negative first in 2000 and 2001 while median revenue and earnings per share followed in 2001 and 2002. Revenue and earnings per share at the median have already turned negative in real terms today compared to inflation at 6.4%. See the table below. Investors are lining up to buy what is likely a mere bear market rally in these stocks at a whopping 30 times earning when median EPS growth is just 2.8% and poised to further deteriorate in our view.
Cash Is King, Stocks Are Trash
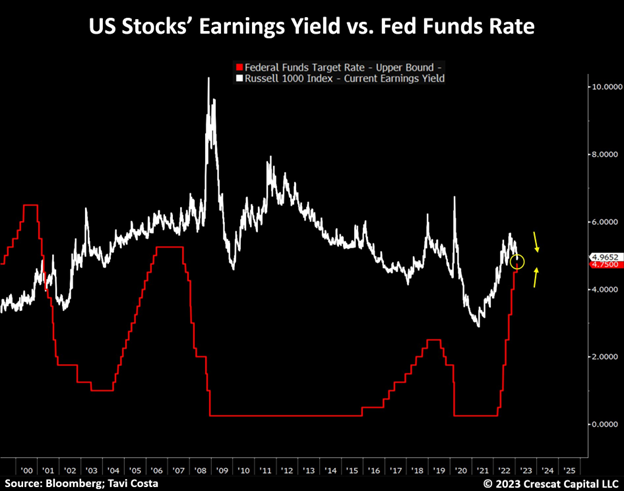
Earnings yield for US stocks is now close to turning negative versus the Fed funds rate for the first time since the tech bust. Yes, equity risk premia were also below zero during most of the 1990s, although, those years were accompanied by very strong growth led by new technologies and the internet. It is hard to believe that we will be entering another decade of above-average growth after one of the strongest bull market periods in history.
Unwarranted Risk
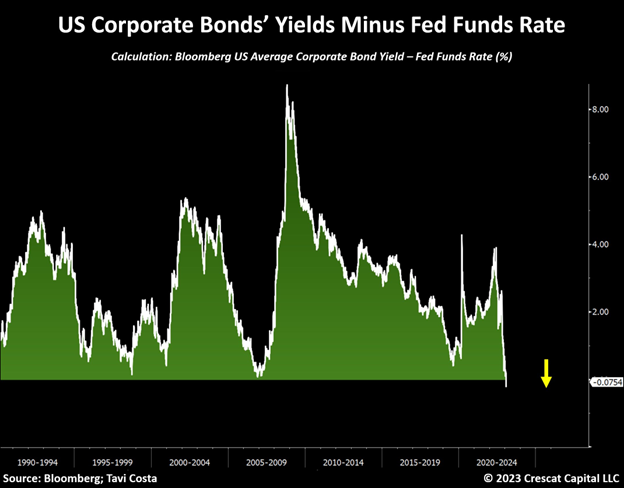
Corporate bonds look even more concerning. The average bond already yields less than the Fed funds rate and is now at its lowest spread in 30 years. Why would anyone take the extra risk of owning these instruments when one can receive over 4.75% yield risk-free? This is arguably the most expensive part of today’s market.
Too Loose for Inflation, Too Tight for Financial Assets
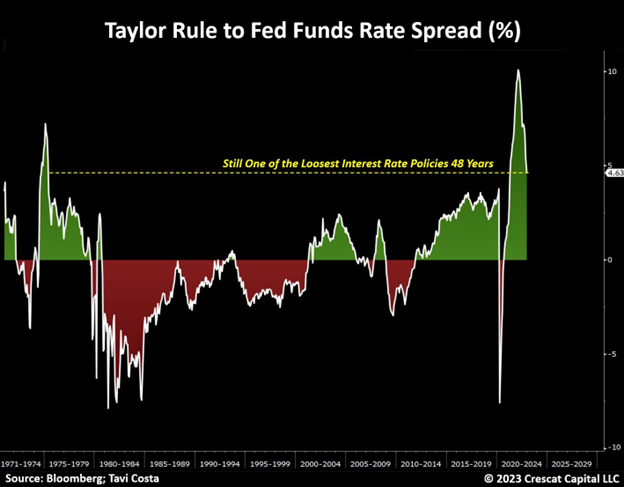
The Fed is playing with fire. Despite the recent rate hikes, financial conditions remain way too loose. This is typical of an early inflationary cycle. The longer inflationary forces persist, the harder will be to expel them from the system.
John Taylor, a Stanford University economist once considered to lead the Federal Reserve, developed a formula to calculate where the Fed funds rate should hypothetically be according to inflation rates, the strength of the labor market, and the potential output of the economy. If we were to apply his baseline model today, it would suggest that the Fed funds rate should be over 4.6% higher than it currently is.
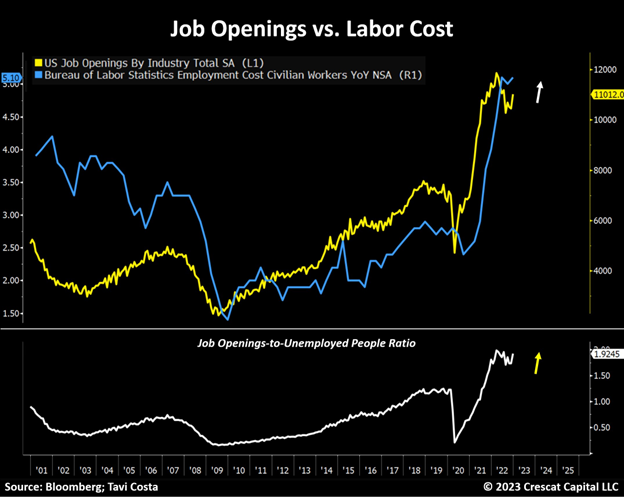
Nearly 2 Jobs Available For Each Unemployed Person
The increase in the cost of living has exacerbated the already severe wealth-gap issues in society, unleashing what is likely to be the early stages of a wage-price spiral. These changes are remarkably similar to what the US economy experienced in the 1970s, which became a key inflationary macro driver of that decade.
Today’s wage growth is arguably one of the largest concerns among policymakers in attempting to fight inflation. The issue is that rising labor cost is unlikely to subside any time soon with job openings at the current levels. There are almost 2 jobs available for each unemployed people today. As shown in the second panel of the chart below, that is near all-time highs.
Additionally, growing deglobalization trends could severely add to this inflationary force, potentially marking the end of a cheap labor era. If these changes manifest themselves, corporate fundamentals could be at risk of severe deterioration.
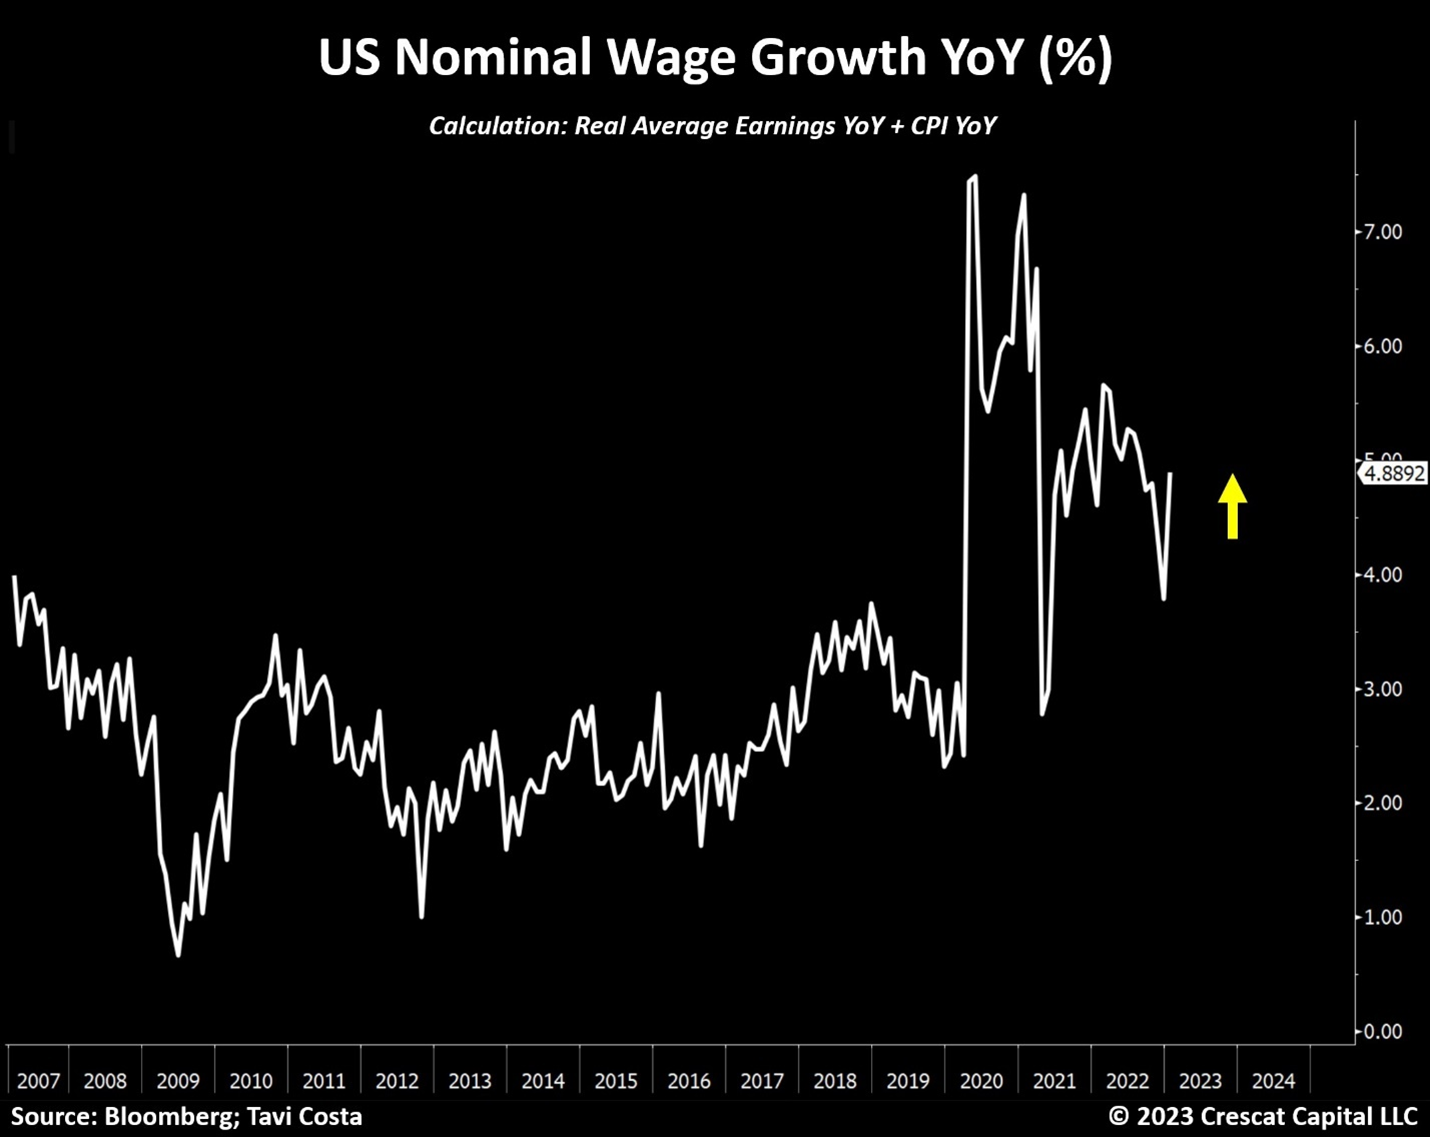
Nominal Wages Trending Higher
There has been a significant change in real wages confirming a recent upward trend. In fact, nominal wage growth is starting to move higher again despite the deceleration in inflation. The rising labor cost pressure is likely to become another secular inflationary driver. Today’s loose monetary conditions by Taylor Rule standards are only exacerbating this macro force.
Commodities’ Supply Cycle
As we have written extensively in our prior letters, the potential for an early-stage wage-price spiral is not our only concern from an inflationary perspective. The chronic period of under-investments among natural resource businesses is yet another critical factor.
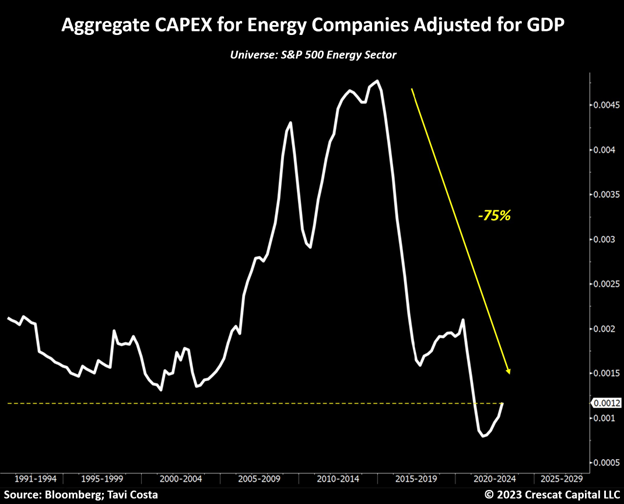
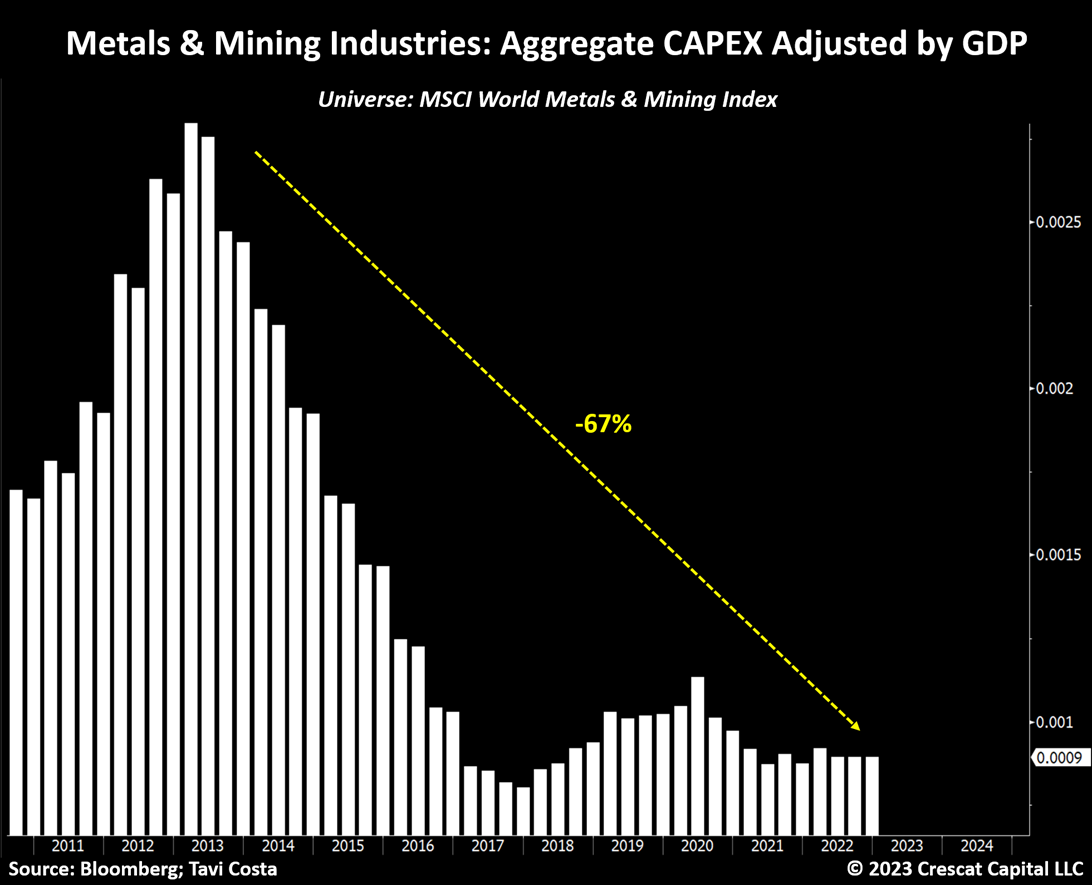
After adjusting for GDP levels, commodity producers are well over 50% below their prior peak in aggregate capital spending. The availability of raw materials follows the capital investment cycle for natural resource industries. However, despite the higher prices in most commodities, producers have severely lagged in their development cycle for bringing new assets into production. It is happening broadly across metals and mining, energy, and agriculture.
Aggregate CAPEX for energy companies adjusted for GDP levels is still below every other depressed level in the last 30-plus years. Current levels are over 75% lower than the prior peak.
This worldwide index of metals and mining companies also shows a nearly 70% decline in capital spending from 2013 levels.
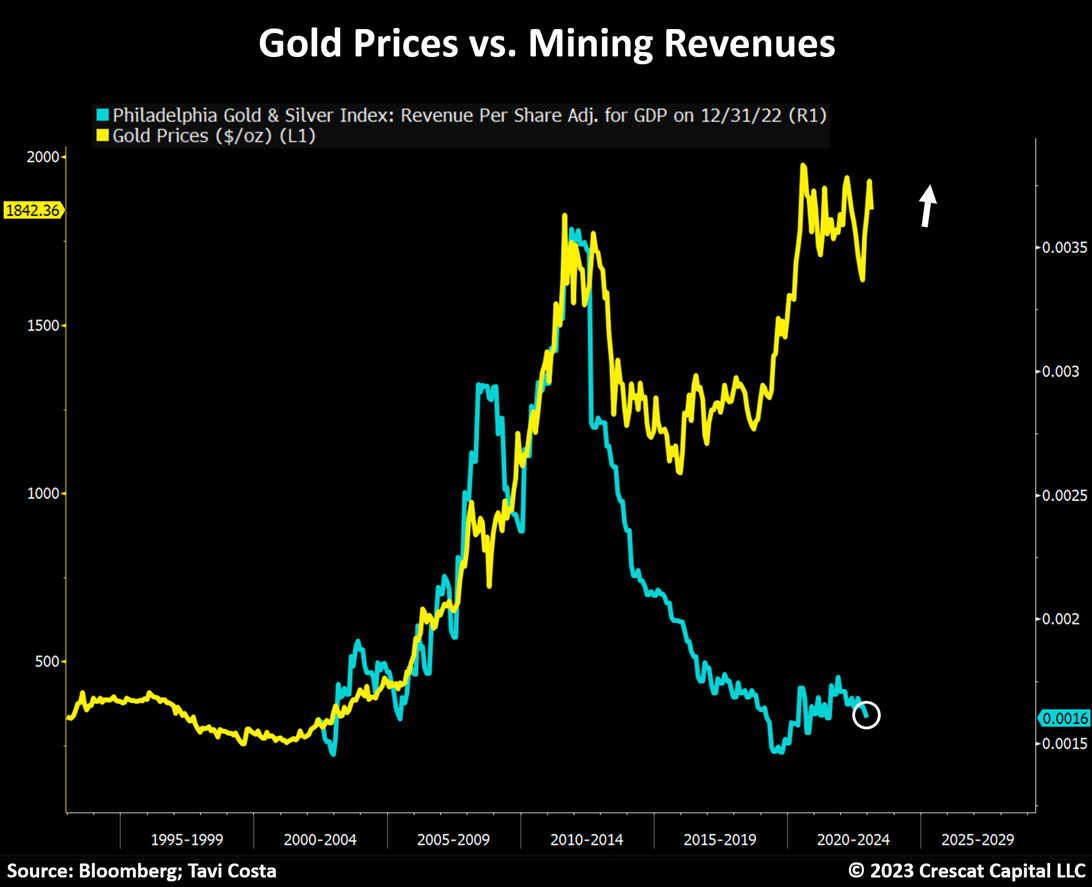
Mining Revenues Stalled While Gold Prices Are Near Record Levels
Gold miners have not been able to increase their revenues while the metal price remains near all-time highs. In short, this is mainly a function of declining industry-wide production, a key part of the macro investment case for gold. The large and mid-tier mining companies have underinvested in exploration as well as M&A, so both the quantity and quality of their reserves have deteriorated over the last decade.
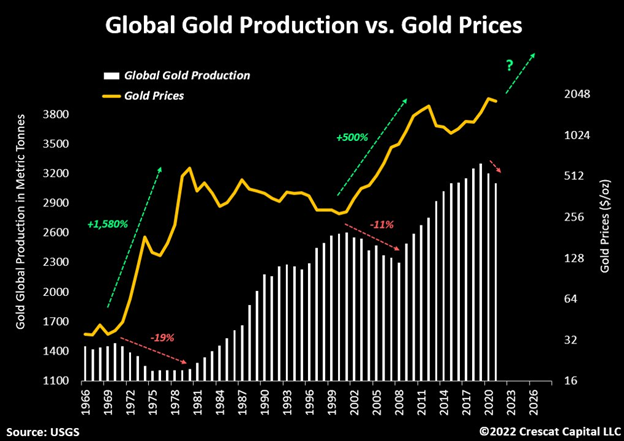
The Likely Beginning of Another Multi-Year Decline in Gold Production
The last two secular bull markets for gold happened on the back of multi-year declines in metal production. Today, this has been amplified by the shift toward battery metals as part of the Green Revolution.
To recall, the energy sector went through a similar issue over the last two years. As ESG mandates gained popularity, oil and gas companies became uninvestable for many capital allocators, especially larger institutions. Nonetheless, the energy sector still managed to have two of its best annual performances in 30 years. We believe a similar environment is setting the stage for gold and silver mining companies today.
Metals of all kinds are critical to electrification, for batteries, solar, wind, and electric grid which are all at the heart of the green energy transition. But there has been a major underinvestment across the entire hard-rock mining industry, a business where industrial and precious metals are byproducts of each other and where the ESG movement has unduly shunned the materials they need most for their own cause.
As investors, our focus remains mostly on where we believe we can create the most value which is by investing at an early stage in exploration assets with the goal of making big new metal discoveries that will be to generating both economic growth and inflation protection. The lack of industry-wide capital, investor attention, and experts with sufficient geologic expertise to navigate the early stages of the mining industry has created a major market inefficiency that Crescat has been exploiting opportunities to find large, scalable, and ultra-high-return potential precious and base metal projects. We believe the spoils will go to those with the ability to combine access to capital and foresight at this critical time with the most experienced and accomplished industry technical and operational experts in the industry. We are also intent on cultivating and attracting the best new talent amongst a much-diminished global graduation pool of geologists and mining engineers. Crescat has been building a portfolio of the most exciting growth mining businesses of the next decade, a portfolio of companies that we believe can and will deliver more new metal discoveries than all the majors combined. The objective is to create substantial wealth for our investors in the process.
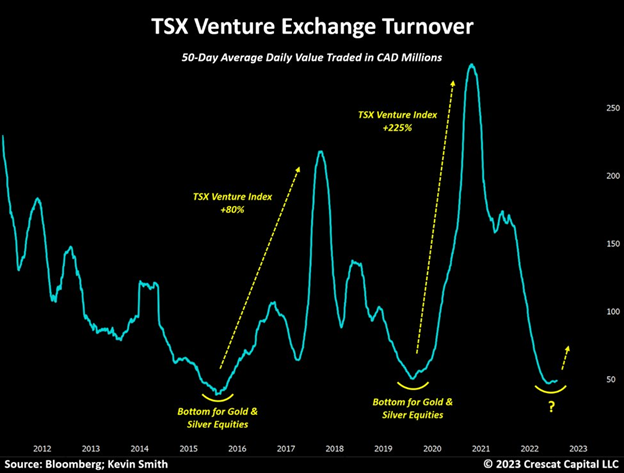
Low Volume Often Precedes Major Turns
The turnover volume for smaller mining companies remains incredibly depressed. As shown in the chart below, the 50-day average traded volume in the TSX Venture Exchange is currently re-testing its prior historical lows. Such levels of disinterest in the part of the industry have often marked major bottoms in share prices. We saw a similar scenario back in 2015 and 2019. In both periods, the TSX Venture index rallied massively over the next one to two years.
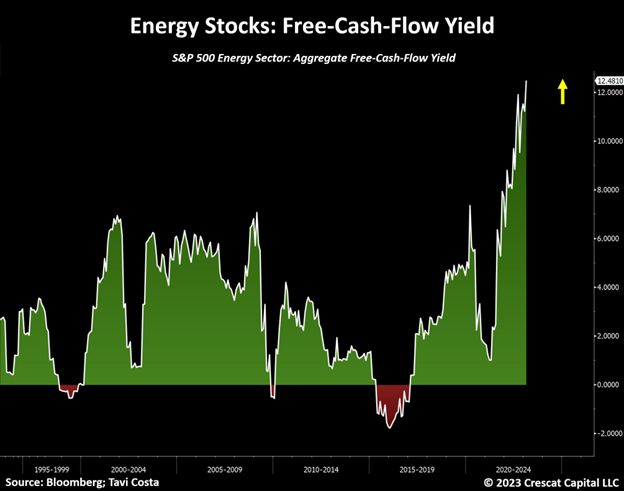
Another Opportunity to Invest in Energy Companies
The recent selloff in energy stocks has set the stage for another opportunity. This sector is again trading at its most undervalued levels in history on a free-cash-flow yield basis. The counterargument is that this measurement is backward-looking, considering that analysts are expecting a 30% decline in the bottom line of these businesses by the end of 2024. We think analysts are too pessimistic, but even at current prices relative to an almost one-third haircut in profits, the overall sector is trading at just 10 times earnings, the lowest level since the bottom of the Global Financial Crisis. If energy prices strengthen, as we envision due to structural shortages and ongoing demand, these companies are even more of a bargain.
Estimated performance through January 31, 2023
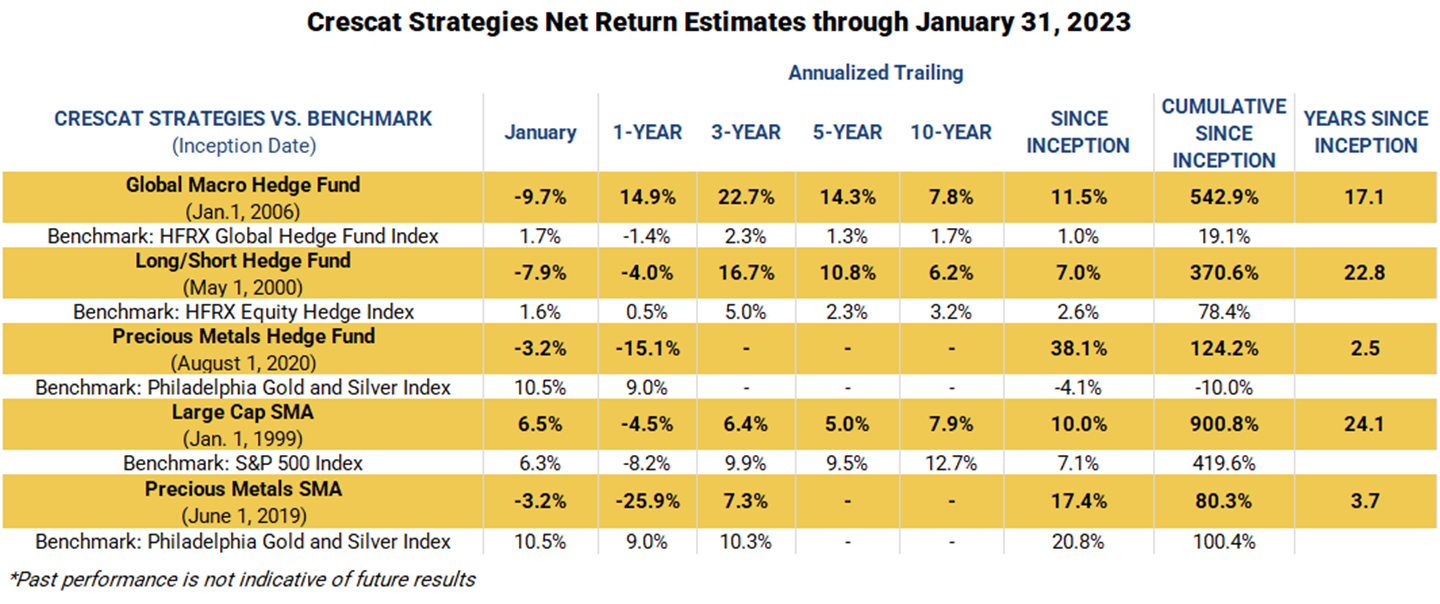
We believe we are at the beginning of an exciting long-term period for macro and value investors:
- The unwinding of speculative bubbles with failing 60-40 portfolios and a full-blown transition from growth to value stocks.
- The re-emergence of gold as the most credible asset to improve the quality of central banks’ balance sheets worldwide.
- The opportunity to invest in historically undervalued commodity-related businesses at the likely early stages of an inflationary decade.
These macro themes continue to be incredibly exciting. While some of the recent market moves have been contrary to our themes, we stay committed to our well-researched market views. Given our value-oriented bias, we are confident that the intrinsic value of our portfolios is always worth substantially more than where the market is valuing them at any point in time.
When the market diverges from our intrinsic value calculations, as it has year-to-date, we are confident that it presents an excellent opportunity for new and existing clients to deploy capital to our strategies.
Sincerely,
Kevin C. Smith, CFA
Member & Chief Investment Officer
Tavi Costa
Member & Portfolio Manager
For more information including how to invest, please contact:
Marek Iwahashi
Client Service Associate
303-271-9997
© 2023 Crescat Capital LLC
Important Disclosures
Performance data represents past performance, and past performance does not guarantee future results. An individual investor’s results may vary due to the timing of capital transactions. Performance for all strategies is expressed in U.S. dollars. Cash returns are included in the total account and are not detailed separately. Investment results shown are for taxable and tax-exempt clients and include the reinvestment of dividends, interest, capital gains, and other earnings. Any possible tax liabilities incurred by the taxable accounts have not been reflected in the net performance. Performance is compared to an index, however, the volatility of an index varies greatly and investments cannot be made directly in an index. Market conditions vary from year to year and can result in a decline in market value due to material market or economic conditions. There should be no expectation that any strategy will be profitable or provide a specified return. Case studies are included for informational purposes only and are provided as a general overview of our general investment process, and not as indicative of any investment experience. There is no guarantee that the case studies discussed here are completely representative of our strategies or of the entirety of our investments, and we reserve the right to use or modify some or all of the methodologies mentioned herein.
This presentation is not an offer to sell securities of any investment fund or a solicitation of offers to buy any such securities. Securities of a fund managed by Crescat may be offered to selected qualified investors only by means of a complete offering memorandum and related subscription materials which contain significant additional information about the terms of an investment in the Fund and which supersedes information herein in its entirety. Any decision to invest must be based solely upon the information set forth in the Offering Documents, regardless of any information investors may have been otherwise furnished, and should be made after reviewing such Offering Documents, conducting such investigations as the investor deems necessary and consulting the investor’s own investment, legal, accounting and tax advisors in order to make an independent determination of the suitability and consequences of an investment in the Fund.
Risks of Investment Securities: Diversity in holdings is an important aspect of risk management, and CPM works to maintain a variety of themes and equity types to capitalize on trends and abate risk. CPM invests in a wide range of securities depending on its strategies, as described above, including but not limited to long equities, short equities, mutual funds, ETFs, commodities, commodity futures contracts, currency futures contracts, fixed income futures contracts, private placements, precious metals, and options on equities, bonds and futures contracts. The investment portfolios advised or sub-advised by CPM are not guaranteed by any agency or program of the U.S. or any foreign government or by any other person or entity. The types of securities CPM buys and sells for clients could lose money over any timeframe. CPM’s investment strategies are intended primarily for long-term investors who hold their investments for substantial periods of time. Prospective clients and investors should consider their investment goals, time horizon, and risk tolerance before investing in CPM’s strategies and should not rely on CPM’s strategies as a complete investment program for all of their investable assets. Of note, in cases where CPM pursues an activist investment strategy by way of control or ownership, there may be additional restrictions on resale including, for example, volume limitations on shares sold. When CPM’s private investment funds or SMA strategies invest in the precious metals mining industry, there are particular risks related to changes in the price of gold, silver and platinum group metals. In addition, changing inflation expectations, currency fluctuations, speculation, and industrial, government and global consumer demand; disruptions in the supply chain; rising product and regulatory compliance costs; adverse effects from government and environmental regulation; world events and economic conditions; market, economic and political risks of the countries where precious metals companies are located or do business; thin capitalization and limited product lines, markets, financial resources or personnel; and the possible illiquidity of certain of the securities; each may adversely affect companies engaged in precious metals mining related businesses. Depending on market conditions, precious metals mining companies may dramatically outperform or underperform more traditional equity investments. In addition, as many of CPM’s positions in the precious metals mining industry are made through offshore private placements in reliance on exemption from SEC registration, there may be U.S. and foreign resale restrictions applicable to such securities, including but not limited to, minimum holding periods, which can result in discounts being applied to the valuation of such securities. In addition, the fair value of CPM’s positions in private placements cannot always be determined using readily observable inputs such as market prices, and therefore may require the use of unobservable inputs which can pose unique valuation risks. Furthermore, CPM’s private investment funds and SMA strategies may invest in stocks of companies with smaller market capitalizations. Small- and medium-capitalization companies may be of a less seasoned nature or have securities that may be traded in the over-the-counter market. These “secondary” securities 12 often involve significantly greater risks than the securities of larger, better-known companies. In addition to being subject to the general market risk that stock prices may decline over short or even extended periods, such companies may not be well-known to the investing public, may not have significant institutional ownership and may have cyclical, static or only moderate growth prospects. Additionally, stocks of such companies may be more volatile in price and have lower trading volumes than larger capitalized companies, which results in greater sensitivity of the market price to individual transactions. CPM has broad discretion to alter any of the SMA or private investment fund’s investment strategies without prior approval by, or notice to, CPM clients or fund investors, provided such changes are not material.
Benchmarks
HFRX GLOBAL HEDGE FUND INDEX. The HFRX Global Hedge Fund Index represents a broad universe of hedge funds with the capability to trade a range of asset classes and investment strategies across the global securities markets. The index is weighted based on the distribution of assets in the global hedge fund industry. It is a tradeable index of actual hedge funds. It is a suitable benchmark for the Crescat Global Macro private fund which has also traded in multiple asset classes and applied a multi-disciplinary investment process since inception.
HFRX EQUITY HEDGE INDEX. The HFRX Equity Hedge Index represents an investable index of hedge funds that trade both long and short in global equity securities. Managers of funds in the index employ a wide variety of investment processes. They may be broadly diversified or narrowly focused on specific sectors and can range broadly in terms of levels of net exposure, leverage employed, holding periods, concentrations of market capitalizations and valuation ranges of typical portfolios. It is a suitable benchmark for the Crescat Long/Short private fund, which has also been predominantly composed of long and short global equities since inception.
PHILADELPHIA STOCK EXCHANGE GOLD AND SILVER INDEX. The Philadelphia Stock Exchange Gold and Silver Index is the longest running index of global precious metals mining stocks. It is a diversified, capitalization-weighted index of the leading companies involved in gold and silver mining. It is a suitable benchmark for the Crescat Precious Metals private fund and the Crescat Precious Metals SMA strategy, which have also been predominately composed of precious metals mining companies involved in gold and silver mining since inception.
RUSSELL 1000 INDEX. The Russell 1000 Index is a market-cap weighted index of the 1,000 largest companies in US equity markets. It represents a broad scope of companies across all sectors of the economy. It is a commonly followed index among institutions. This index contains many of the same securities as the S&P 500 but is broader and includes some mid-cap companies. It is a suitable benchmark for the Crescat Large Cap SMA strategy, which has predominantly held and traded similar securities since inception.
S&P 500 INDEX. The S&P 500 Index is perhaps the most followed stock market index. It is considered representative of the U.S. stock market at large. It is a market cap-weighted index of the 500 largest and most liquid companies listed on the NYSE and NASDAQ exchanges. While the companies are U.S. based, most of them have broad global operations. Therefore, the index is representative of the broad global economy. It is a suitable benchmark for the Crescat Global Macro and Crescat Long/Short private funds, and the Large Cap and Precious Metals SMA strategies, which have also traded extensively in large, highly liquid global equities through U.S.-listed securities, and in companies Crescat believes are on track to achieve that status. The S&P 500 Index is also used as a supplemental benchmark for the Crescat Precious Metals private fund and Precious Metals SMA strategy because one of the long-term goals of the precious metals strategy is low correlation to the S&P 500.
References to indices, benchmarks or other measures of relative market performance over a specified period of time are provided for your information only. Reference to an index does not imply that the fund or separately managed account will achieve returns, volatility or other results similar to that index. The composition of an index may not reflect the manner in which a portfolio is constructed in relation to expected or achieved returns, portfolio guidelines, restrictions, sectors, correlations, concentrations, volatility or tracking.
Separately Managed Account (SMA) disclosures: The Crescat Large Cap Composite and Crescat Precious Metals Composite include all accounts that are managed according to those respective strategies over which the manager has full discretion. SMA composite performance results are time-weighted net of all investment management fees and trading costs including commissions and non-recoverable withholding taxes. Investment management fees are described in Crescat’s Form ADV 2A. The manager for the Crescat Large Cap strategy invests predominantly in equities of the top 1,000 U.S. listed stocks weighted by market capitalization. The manager for the Crescat Precious Metals strategy invests predominantly in a global all-cap universe of precious metals mining stocks.
Hedge Fund disclosures: Only accredited investors and qualified clients will be admitted as limited partners to a Crescat hedge fund. For natural persons, investors must meet SEC requirements including minimum annual income or net worth thresholds. Crescat’s hedge funds are being offered in reliance on an exemption from the registration requirements of the Securities Act of 1933 and are not required to comply with specific disclosure requirements that apply to registration under the Securities Act. The SEC has not passed upon the merits of or given its approval to Crescat’s hedge funds, the terms of the offering, or the accuracy or completeness of any offering materials. A registration statement has not been filed for any Crescat hedge fund with the SEC. Limited partner interests in the Crescat hedge funds are subject to legal restrictions on transfer and resale. Investors should not assume they will be able to resell their securities. Investing in securities involves risk. Investors should be able to bear the loss of their investment. Investments in Crescat’s hedge funds are not subject to the protections of the Investment Company Act of 1940. Performance data is subject to revision following each monthly reconciliation and annual audit. Current performance may be lower or higher than the performance data presented. The performance of Crescat’s hedge funds may not be directly comparable to the performance of other private or registered funds. Hedge funds may involve complex tax strategies and there may be delays in distribution tax information to investors.
Investors may obtain the most current performance data, private offering memoranda for Crescat’s hedge funds, and information on Crescat’s SMA strategies, including Form ADV Part II, by contacting Linda Smith at (303) 271-9997 or by sending a request via email to lsmith@crescat.net. See the private offering memorandum for each Crescat hedge fund for complete information and risk factors.