In our view, we stand on the cusp of a major transformation in the foreign exchange (FX) markets: a likely significant depreciation of the US dollar relative to other currencies over the next several years. Allow us to elaborate.
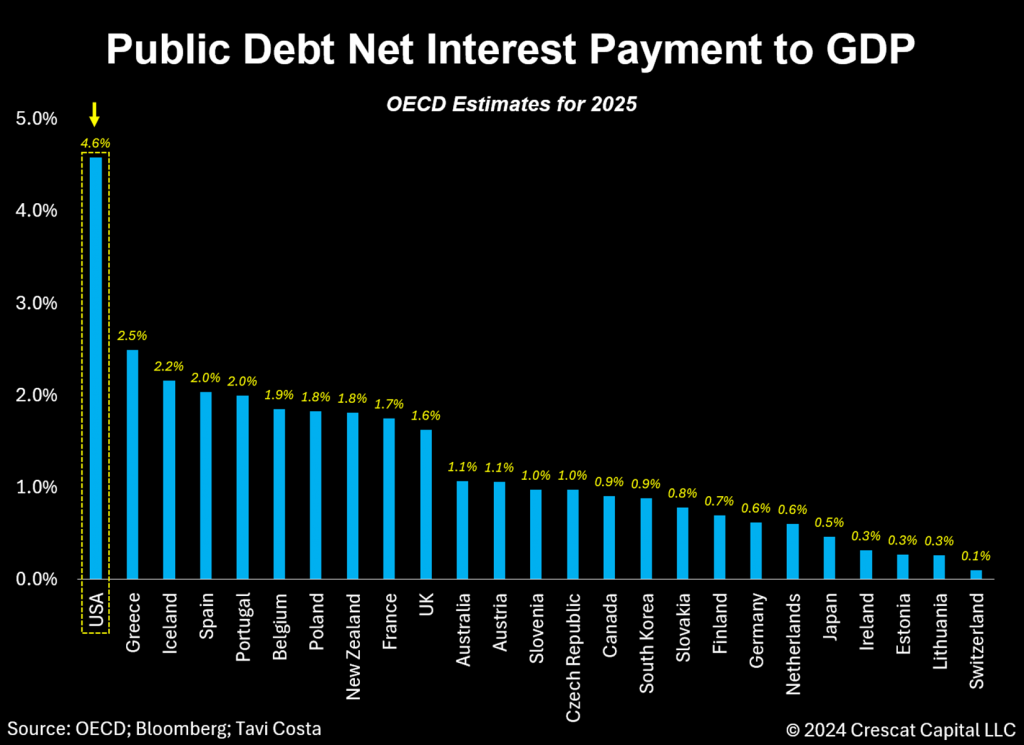
The Federal Reserve’s current interest rate policy is entirely misaligned with the magnitude of the debt problem, putting the US economy in a precarious situation. As illustrated in the chart below, this issue is notably more severe compared to other developed countries. According to the Organization for Economic Cooperation and Development (OECD), by next year the US will face by far the highest cost for servicing its debt among all developed market economies it tracks by next year.
This predicament has swiftly shifted from a long-term issue to an immediate challenge, and we believe it may force several reductions in the Fed funds rate that call into question the Fed’s ability to achieve its dual mandate of maximum employment and price stability.
Such a drastic reversal in policy stance by the Fed is likely to exert substantial downward pressure on the dollar relative to hard assets, but also versus other fiat currencies that do not face the same urgency to reduce debt costs.
Debt Service Cost in Uncharted Waters
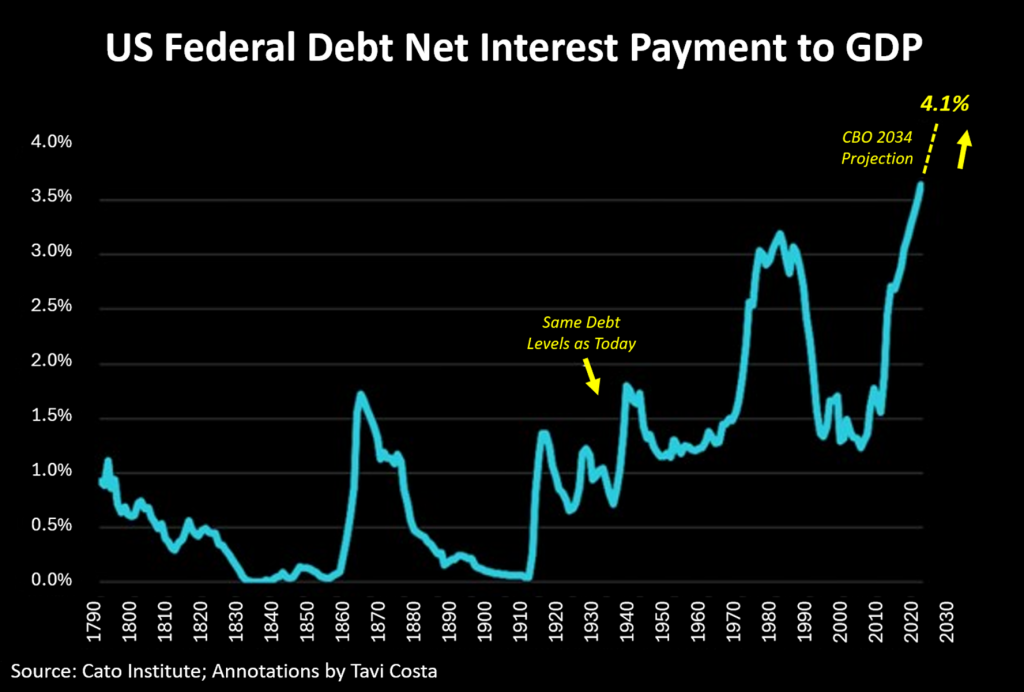
Irrespective of the political party in power, the following chart is probably the most important issue in today’s economy, which we anticipate will likely have major implications for the US dollar. Net interest payment as a percentage of GDP is projected to reach its highest level in over two centuries. Note that the 4.1% figure for 2034 is based on Congressional Budget Office (CBO) estimates which historically have been too optimistic relative to ultimate reality.
The core of this perspective is that the potential near-term benefits of cutting interest rates to ease the debt burden are tangible and achievable but also likely at odds with the Fed’s long-term goal of low inflation and full employment.
While other economies may have worse debt imbalances, none experience the same level of pressure from debt maintenance costs as the US. For example, Japan, one of the most indebted developed nations globally, has managed to maintain an exceptionally low cost of debt through interest rate suppression and yield curve control measures. Let us emphasize, however, that this approach has led to a significant collapse in the value of the yen versus other fiat currencies, and especially relative to hard assets.
Additionally, observe where debt service levels are today compared to the 1940s, when the debt issue was equally severe. The urgent need for financial repression in the US economy has never been more apparent.
America’s Fiscal Exceptionalism
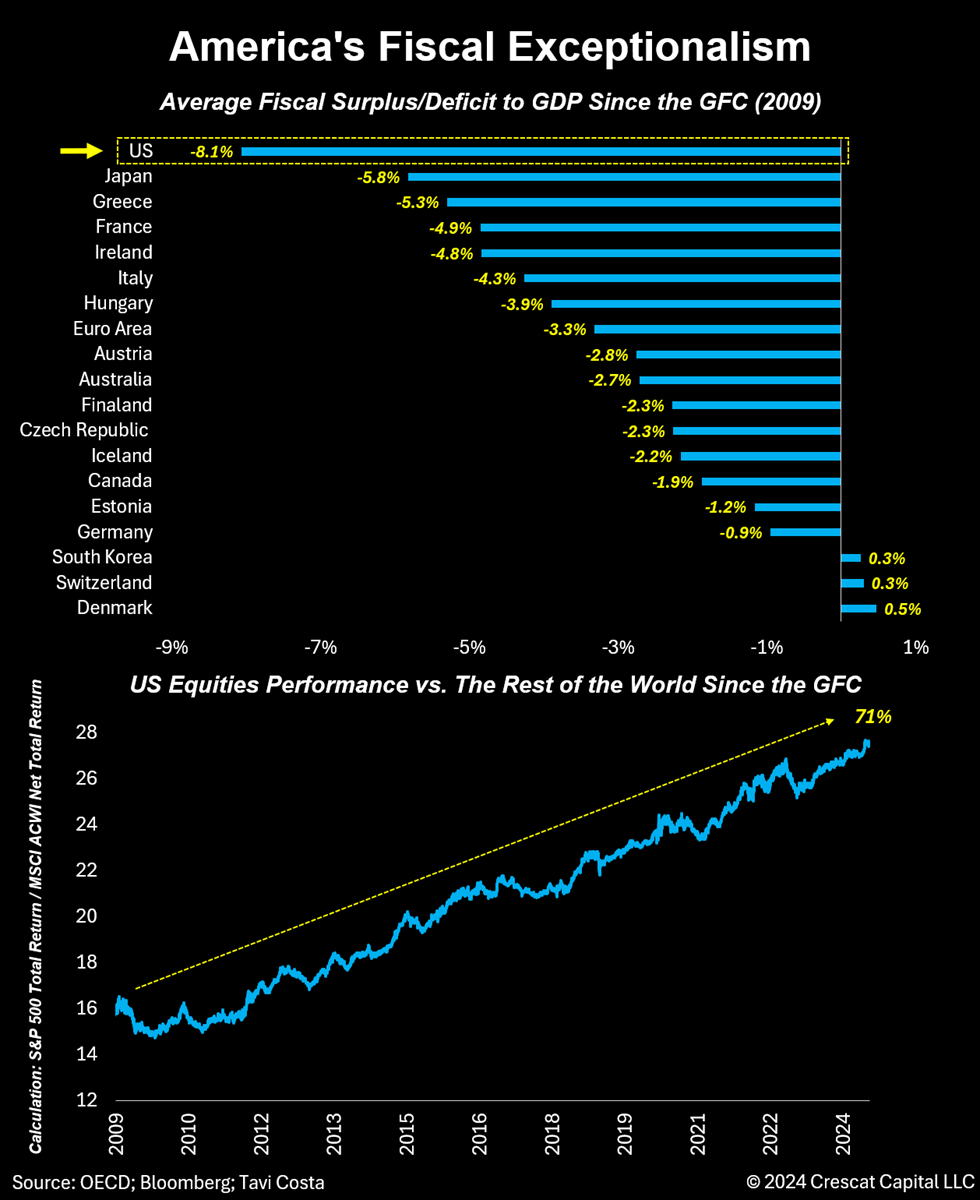
Since the Global Financial Crisis, the US has experienced one of the most pronounced periods of outperformance for its equities versus the rest of the world in history. From a macro perspective, America’s exceptional economic growth has been primarily driven by its significantly large fiscal deficits compared to other nations. This has been made possible largely due to the US dollar’s role as a reserve currency, which allows the US to pursue a more expansive fiscal agenda than other countries.
Since 2009, no other country has run a government deficit as steep as the US when looking at the average fiscal surplus or deficit relative to GDP. We believe this spending differential has spurred growth and attracted capital to US financial markets, explaining why the rest of the world has drastically underperformed for more than a decade. This strength in US equities compared to other countries is illustrated in the second panel of the chart below, which shows the relative performance of the S&P 500 versus the MSCI World Excluding the US index, indicating a 71% growth since 2009.
Given the surging cost of debt, it is reasonable to question whether the US economy can continue to sustain this level of fiscal dominance, particularly in comparison to other nations. Historically, three potential solutions have emerged for addressing such a challenge: austerity measures, political tools to suppress debt service costs, or, more radically, debt restructuring.
The 1940s provide a pertinent example, as the US employed some of these strategies. At that time, policymakers achieved a primary fiscal surplus while using yield curve controls to lower interest rates. Allowing inflation to exceed historical norms also played a role in significantly reducing the debt imbalance over the following decades. We believe a similar combination of policies will be needed today, although initially, interest rate suppression may be the most appropriate strategy in a world where the AI revolution, electrification, onshoring, modernization of manufacturing capabilities, and increasing deglobalization are unfolding.
As Stanley Druckenmiller once observed, one of the most effective ways to strengthen a currency is by adopting a tight monetary policy alongside an aggressive fiscal agenda. This has been the playbook that has kept the dollar strong, but it is unsustainable due to the current debt imbalances.
Although currency markets behave on a relative basis, the pressing need for the US to adjust its interest rate policy indicates that the dollar is likely to face adverse effects from these potential changes in monetary and fiscal stance.
To clarify, the central issue is not the debt imbalance per se, as history has seen even more severe public debt distortions. The real problem lies in the disconnect between the current interest rate policy and the size of the federal debt. To manage the existing liability effectively, substantial reductions in debt service payments relative to GDP are necessary, which is in stark contrast to the approaches taken by other economies at present.
Currently, tariffs are being heavily discussed as a potential means to address the government’s net spending issues. Historically, tariffs were the federal government’s primary source of revenue, especially during the 1800s. The 1920s also saw substantial tariffs being imposed, with revenues from these protectionist policies amounting to nearly 1.5% of GDP in 1929, compared to just 0.3% today.
We believe that tariffs are likely to become a significant revenue source for the US economy once again.
USD Devaluation Signals Emerging
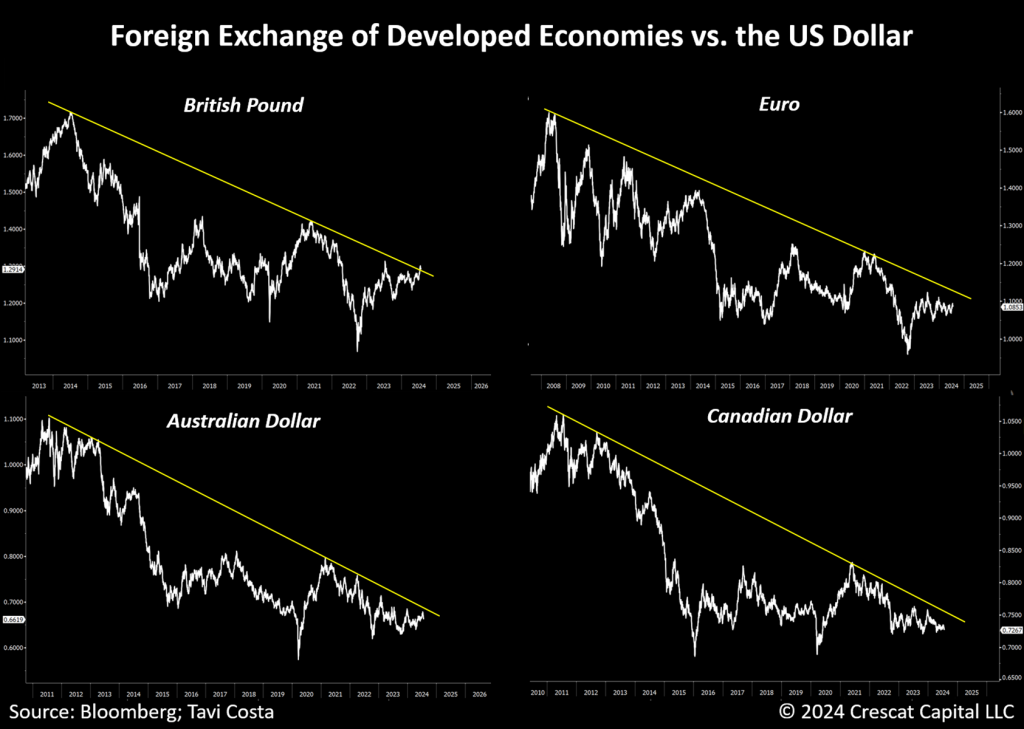
It is crucial to pay attention to assets that exhibit resilience despite major macro headwinds that should typically negatively impact their prices. This is exactly what we are observing with most currencies relative to the US dollar recently.
Multiple fiat currencies have begun to exhibit remarkable strength, potentially marking a historical bottom, despite one of the most aggressive interest rate differentials between the US and the rest of the world. The positive carry for holding US dollars should be driving a major inflow into the currency, particularly compared to gold and other hard assets. Instead, we have seen metals surge during one of the most aggressive hiking cycles since the 1970s.
These changes in market structure are notable and likely mark the beginning of a trend. We tend to favor currencies of economies with significant exposure to natural resources. In our hedge funds, we have chosen to hold a sizeable, long position in the Canadian dollar to reflect this view. Bearish dollar trends tend to be highly positive for emerging markets and their companies. We have significant exposure to mining companies across South America and also own broader Brazilian equities.
Just as we experienced the chain reaction from inflation becoming entrenched to interest rates rising and sovereign debt instruments falling in price, we believe the US dollar is the next domino to fall which in turn will push precious metals to substantially higher levels.
Multiple Rate Cuts Likely Ahead
In our assessment, the Fed’s hands are tied by the escalating cost of federal debt, increasing the likelihood of multiple rate cuts. This anticipated policy shift would align with investors’ massive overreaction, moving from being overly concerned with seven rate cuts priced in at the beginning of the year to now being overly complacent with only two implied cuts.
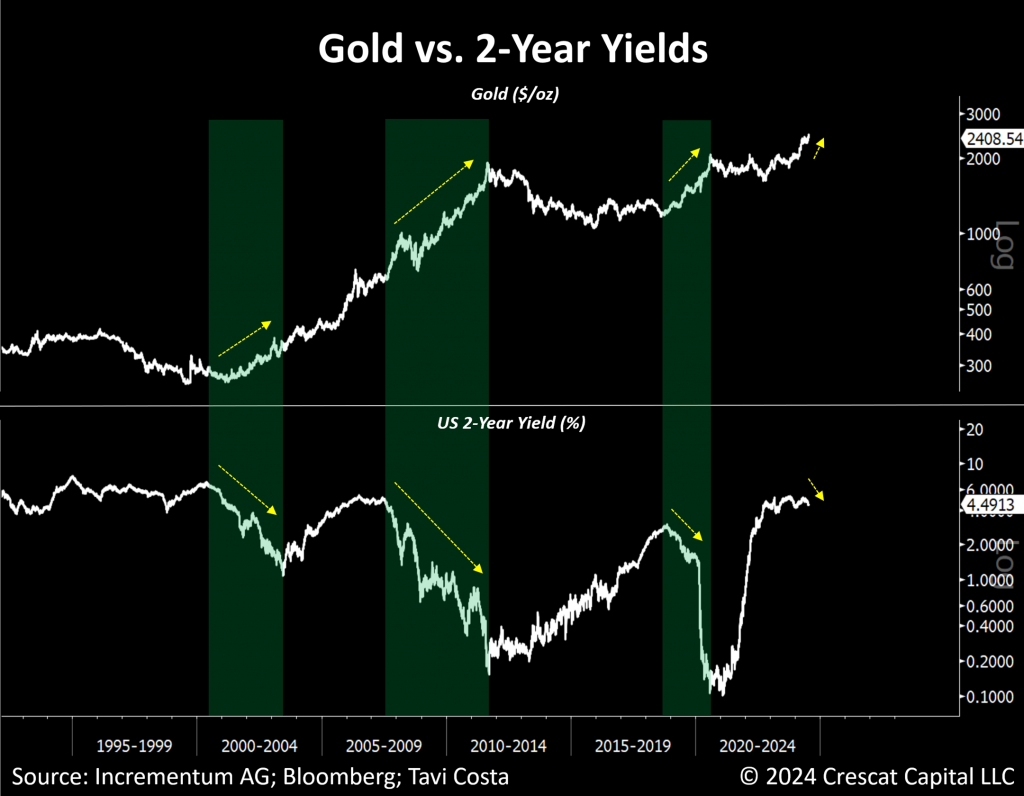
In our analysis, if history is any indication, a substantial drop in short-term interest rates is likely to create a strong tailwind for gold prices. We saw this effect in the early 2000s, during the housing bubble, and again in 2019, before the pandemic recession.
We would like to credit our friends at Incrementum AG for inspiring the chart below.
When Resistance Becomes Support
The historical trend of short-term interest rates also reinforces our expectation of several forthcoming interest rate cuts. Consequently, the narrowing interest rate differential between the Fed and other central banks is likely to put further downward pressure on the US dollar.
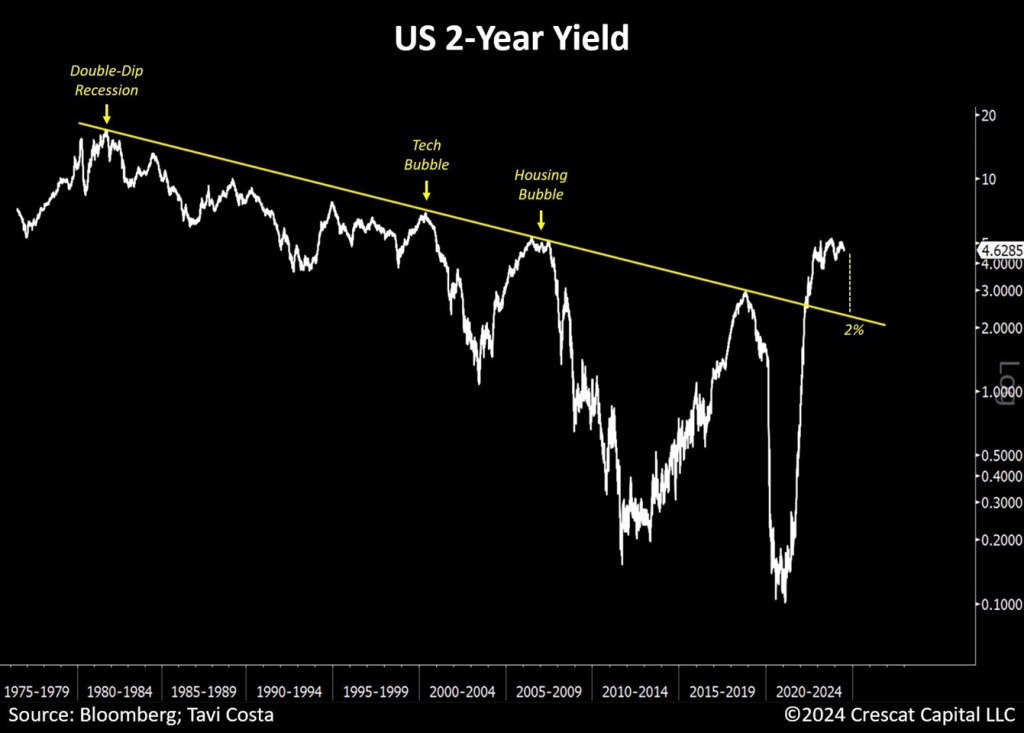
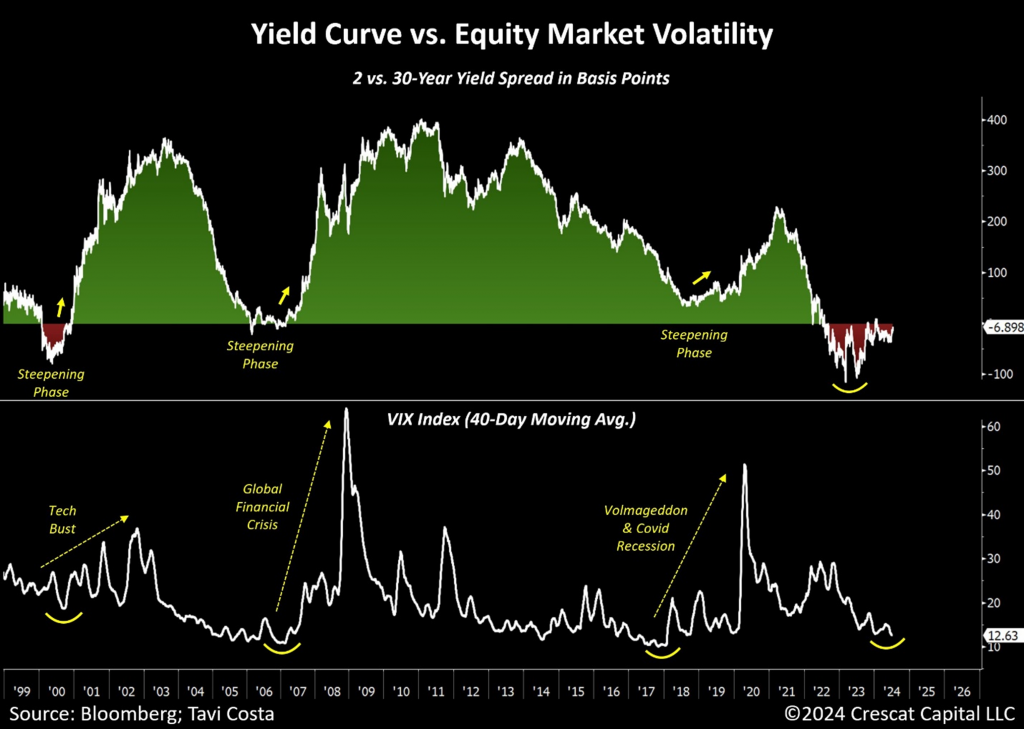
Not to mention, we believe the risk of a recession has significantly increased in recent months, particularly with the steepening of the yield curve from deeply inverted levels. In our view, today’s suppression of volatility is characteristic of what we often see before a recession, commonly referred to as the calm before the storm.
We believe the 2-year yield is likely to re-test its prior resistance level forming a major support.
Structural Twin Deficits
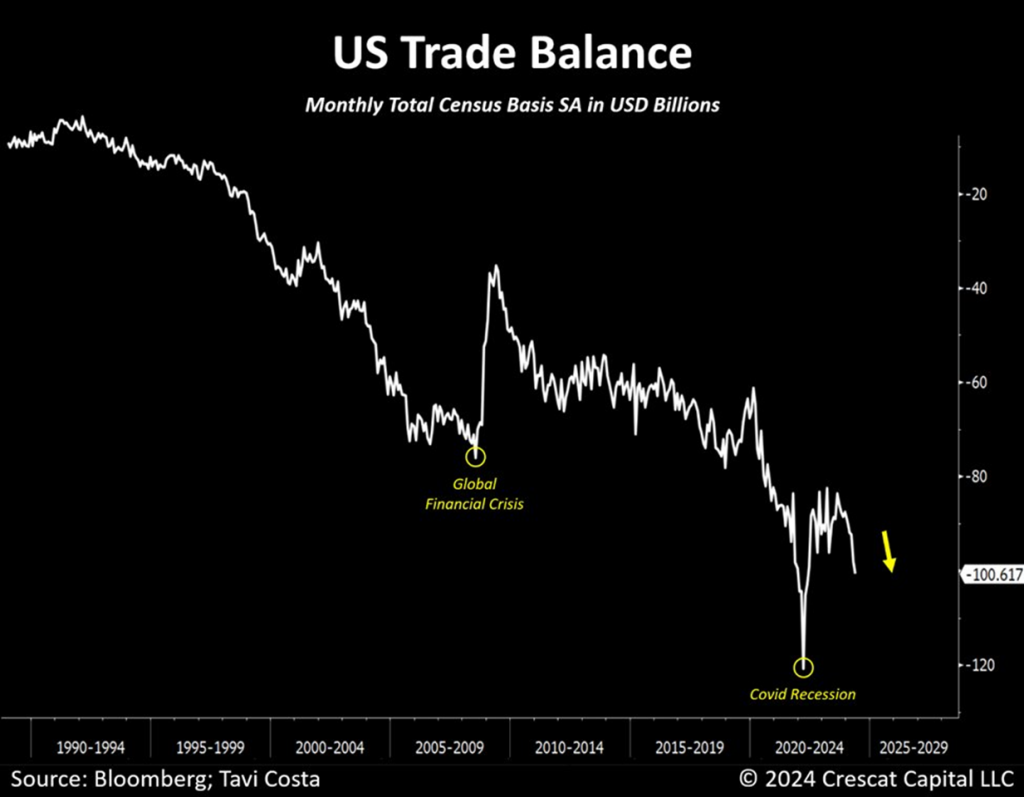
The following macro development also merits closer examination. This month’s US trade balance report shows a continued and noteworthy decline, driven mainly by a sharp rise in imports. While this might seem insignificant at first glance, a trade balance deficit approaching 4% is considerable, especially given the US’s fiscal deficit exceeding 6% of GDP.
The US now faces a 10% twin deficit, worse than during the peak of the Tech Bust and not far from the depths of the Global Financial Crisis. This situation poses serious funding risks for US Treasuries, compelling the Fed to increasingly assume the role of primary financier of government debt.
For context, three Fed rate cuts could reduce the annual cost of federal debt by a third. Today’s environment bears a striking resemblance to the 1940s. Back then, with a severe debt situation, the Fed had to prioritize debt servicing through yield curve control, even at the expense of inflation concerns. However, today’s inflation problem is arguably more entrenched.
There are notable differences: in the 1940s, the world was emerging from a highly deglobalized era following World War II, and the US monetary system was more disciplined with the dollar pegged to gold. In contrast, today’s situation is almost the complete opposite. Geopolitical risks are escalating, the money supply has been continually growing, government deficit spending is on a reckless unsustainable growth path, while global economies prioritize rebuilding infrastructure in the face of fundamentally constrained commodity supplies.
This context highlights the growing likelihood that hard assets and natural resource equities will re-emerge as a preferred investment alternative to overvalued financial assets in the new business cycle.
Foreign Investment Saturation in US Equities
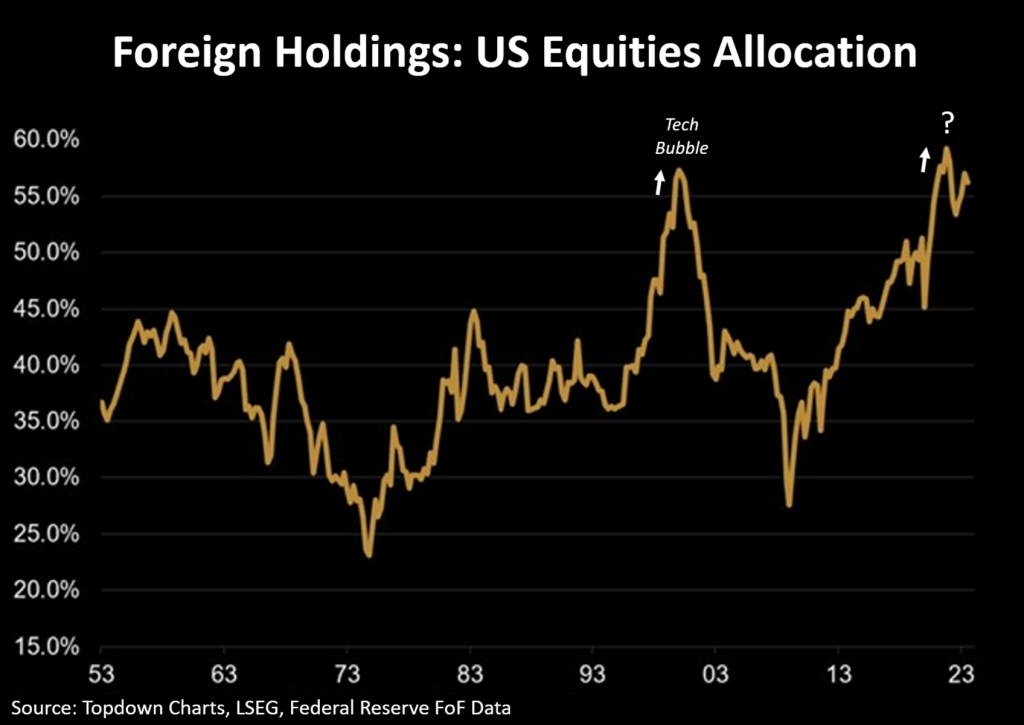
As the currency market approaches a significant repositioning, we believe other asset classes could be greatly influenced by these capital flows. The frothiness of US equities and the potential impact of these macro trends on one of the most expensive stock markets in history cannot be ignored.
America’s fiscal exceptionalism has led to one of the most significant allocations in US equities by foreign investors, nearing the levels seen at the peak of the Tech Bubble in 2000.
We continue to question where the capital will come from to sustain such inflated valuations. Like the period following the Tech Bubble, the gradual unwinding of crowded sectors like technology is likely to trigger another major rotation from growth to value. It is our opinion that long-overlooked segments such as emerging markets, natural resource companies, and value-driven stocks are poised to emerge as significant winners throughout the next decade.
A Macro Regime Change
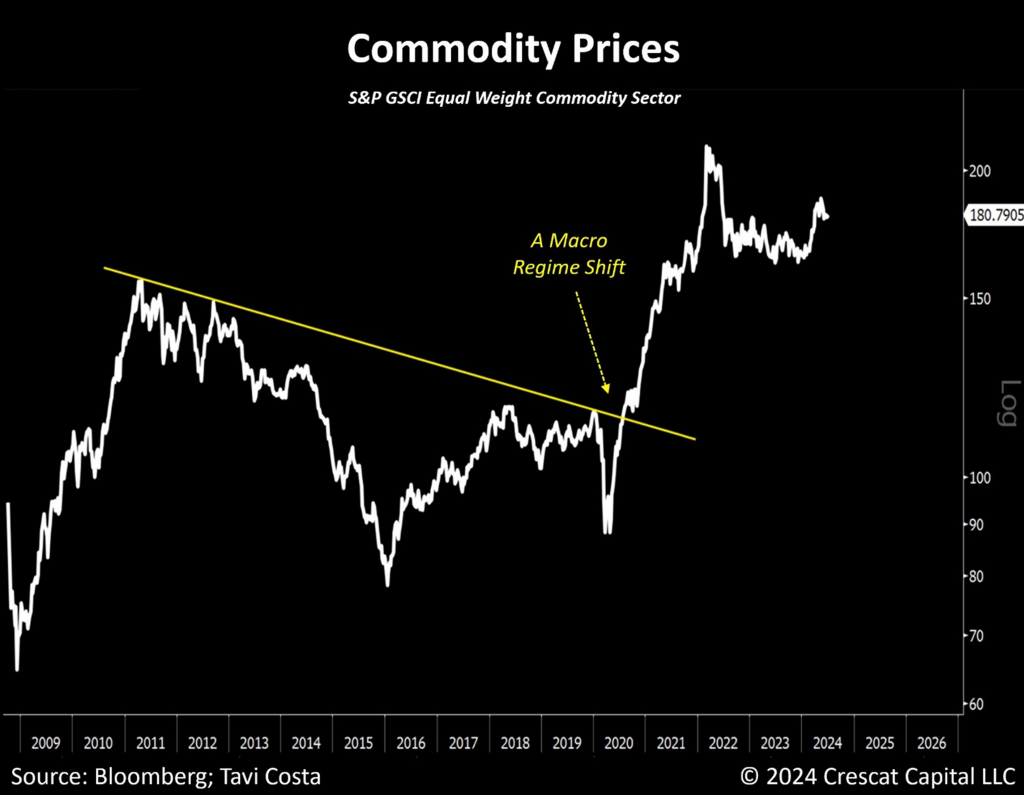
The response of policymakers during the pandemic marked a pivotal moment in history. Since then, we have been experiencing a macro regime shift that manifests in various ways.
Inflation has resurged, interest rates have bottomed out, and commodities have ended a long period of decline. Deglobalization has escalated, central banks have initiated a gold rush, safe-haven currencies like the Japanese yen have collapsed, political populism has resurged, and inequality issues have worsened, among other developments.
The chart below is a simple example of these developing trends. After a major breakout, overall commodities stocks have been consolidating for some time. From our perspective, a second upward move is likely upon us.
Asset Allocation Asymmetry
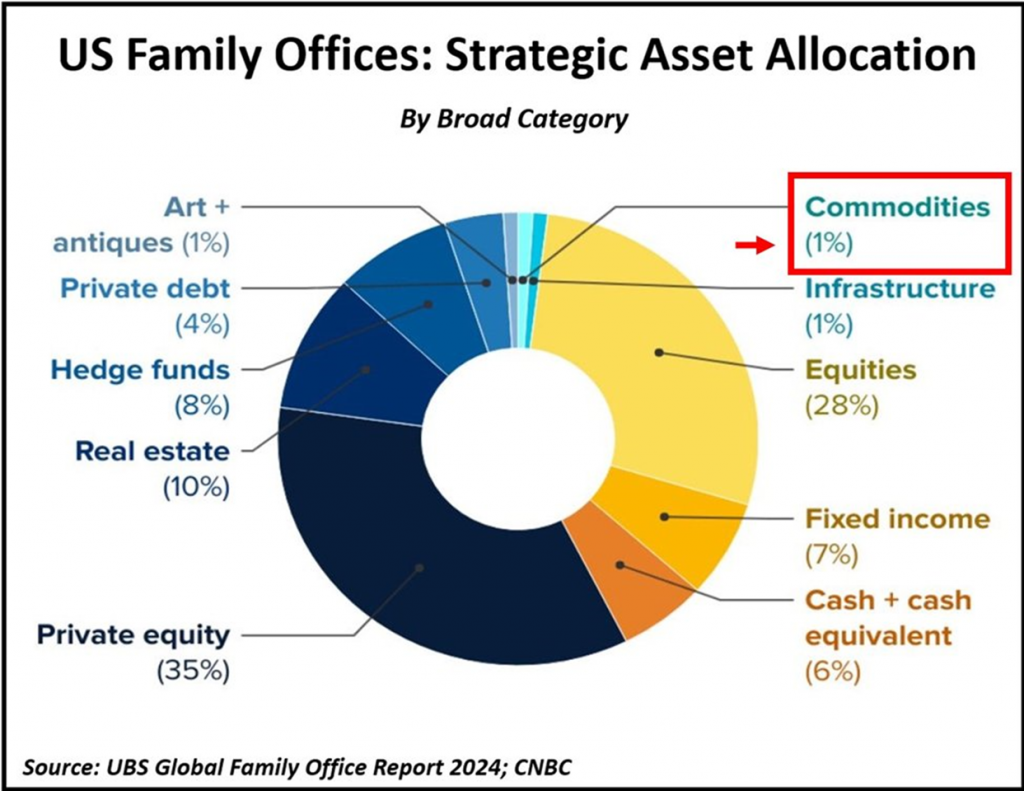
US family offices currently allocate just 1% of their assets to commodities, including gold. We expect them along with institutional investors to soon start moving into these markets in earnest.
Extended periods of neglect in natural resource sectors often precede the emergence of secular opportunities. That is particularly the case in an escalating deglobalized environment, marked by highly constrained commodity supplies and the gradual buildup of structural demand forces from central banks, traditional 60/40 portfolios, and other major capital allocators.
Miners Yet to Lead
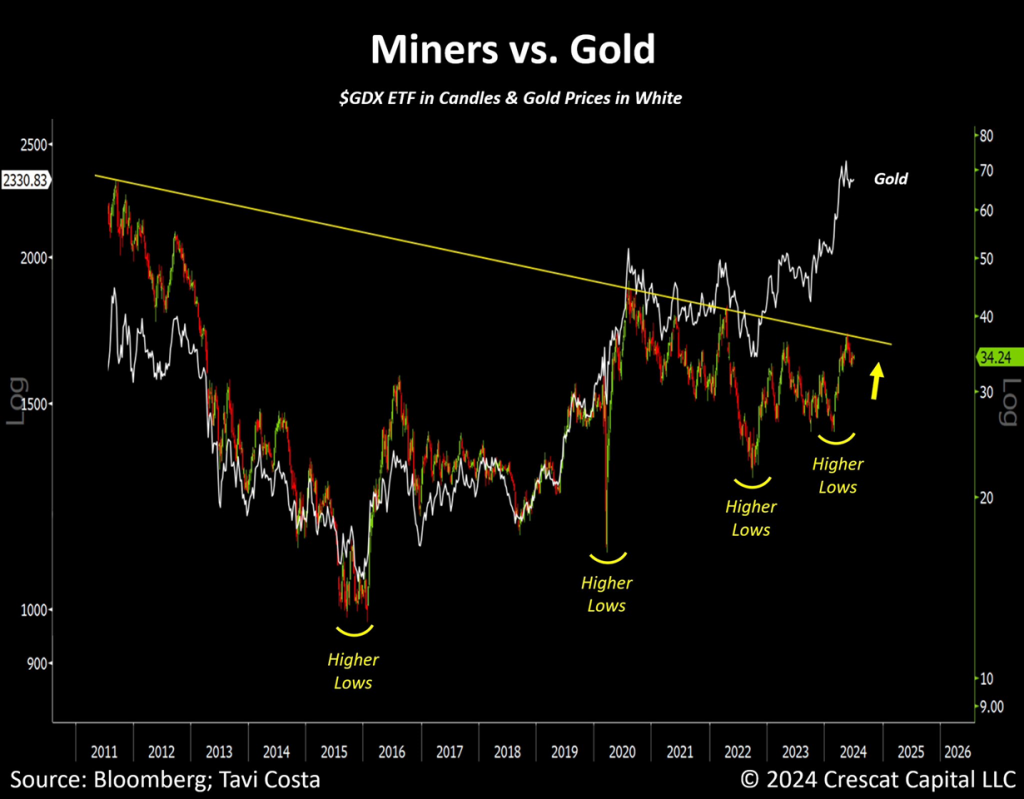
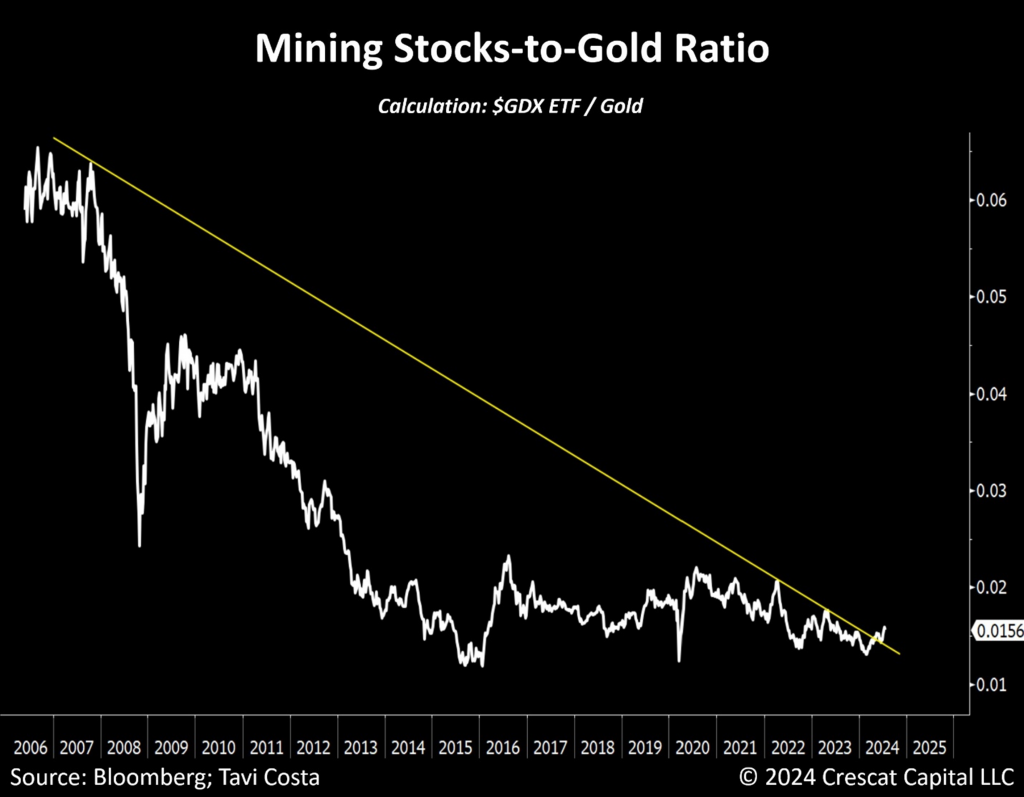
If there was ever a technical setup for one of the most hated industries in the market, it’s now. The notion that gold miners won’t follow gold prices this time is one of the most historically unsupported opinions we’ve heard.
We are of the opinion that a potential breakout from this prolonged resistance would prompt a wave of investors to shift their overly bearish stance.
As Sam Zell once said:
“Great money is made at businesses that lack capital interest, not the other way around.”
A Silver Rush
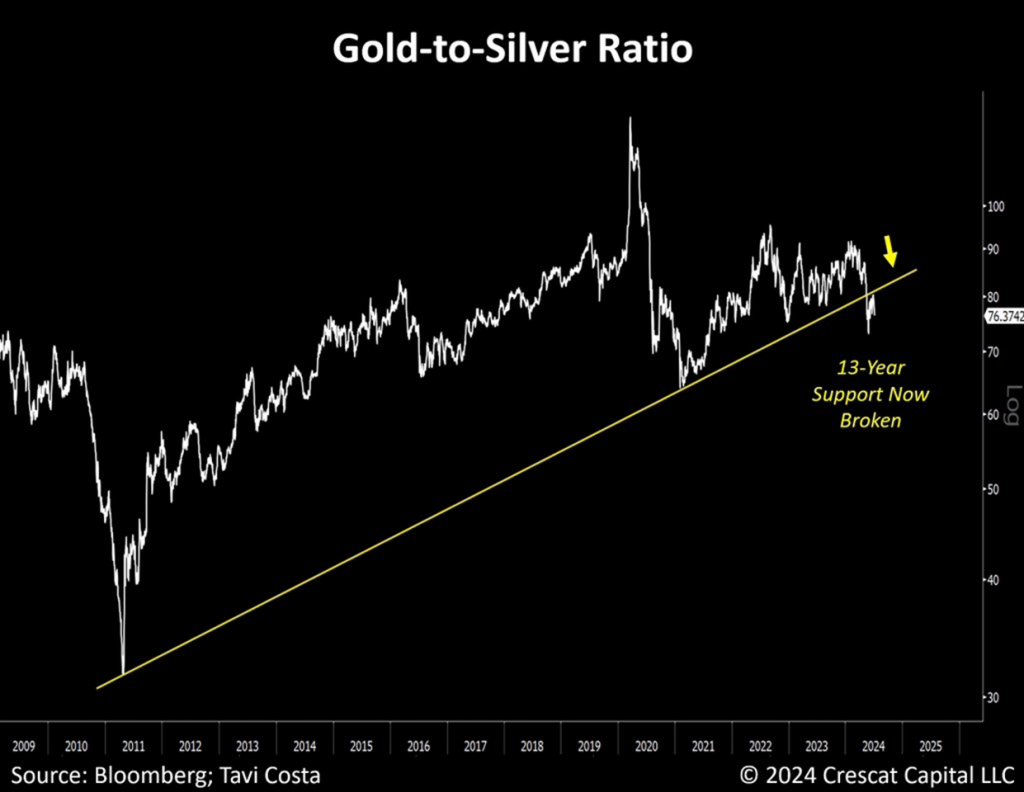
After breaking 13-year support two months ago, the gold-to-silver ratio appears to be at an early-stage downward trend.
Although we firmly believe that gold remains historically attractive relative to the money supply and the current lack of fiscal discipline, we are hard-pressed to find anything that is more undervalued and with more asymmetric upside potential in this macro environment than silver.
Retail on the Sidelines
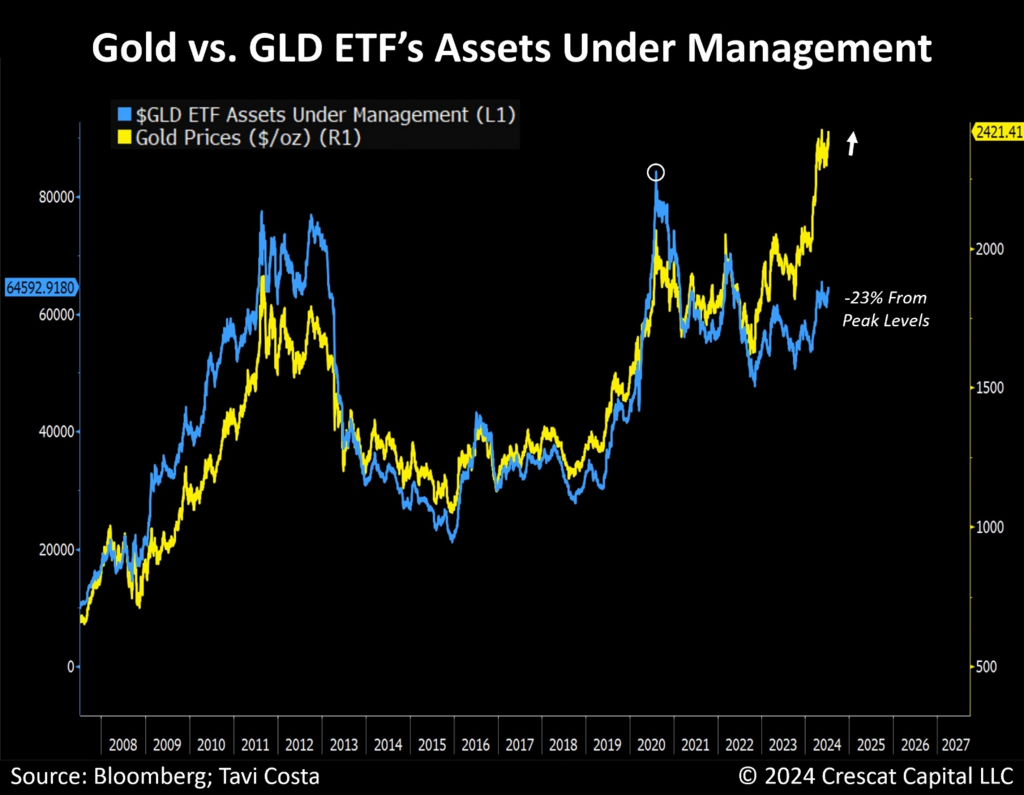
Gold is on the verge of making new highs again, yet retail investors remain on the sidelines. For us, this indicates just how early we are in the cycle for gold and other precious metals. Take note of the steady relative performance of miners in recent weeks, shown below on the chart comparing VanEck Gold Miners ETF-to-gold ratio. We are likely experiencing a meaningful shift in this industry.
Historically Undervalued Mining Companies
Notice the resilience of miners on a day when gold is down significantly. We’re likely witnessing a historical bottom in the miners-to-gold ratio’s downward trend.
Consider what’s been happening in the copper industry: mining companies have consistently outperformed the metal in recent years. In our view, gold companies are getting ready to experience the same development.
VanEck Gold Miners ETF (GDX®) seeks to replicate as closely as possible, before fees and expenses, the price and yield performance of the NYSE Arca Gold Miners Index (GDMNTR), which is intended to track the overall performance of companies involved in the gold mining industry.
The Gold Standard of Recession Indicators
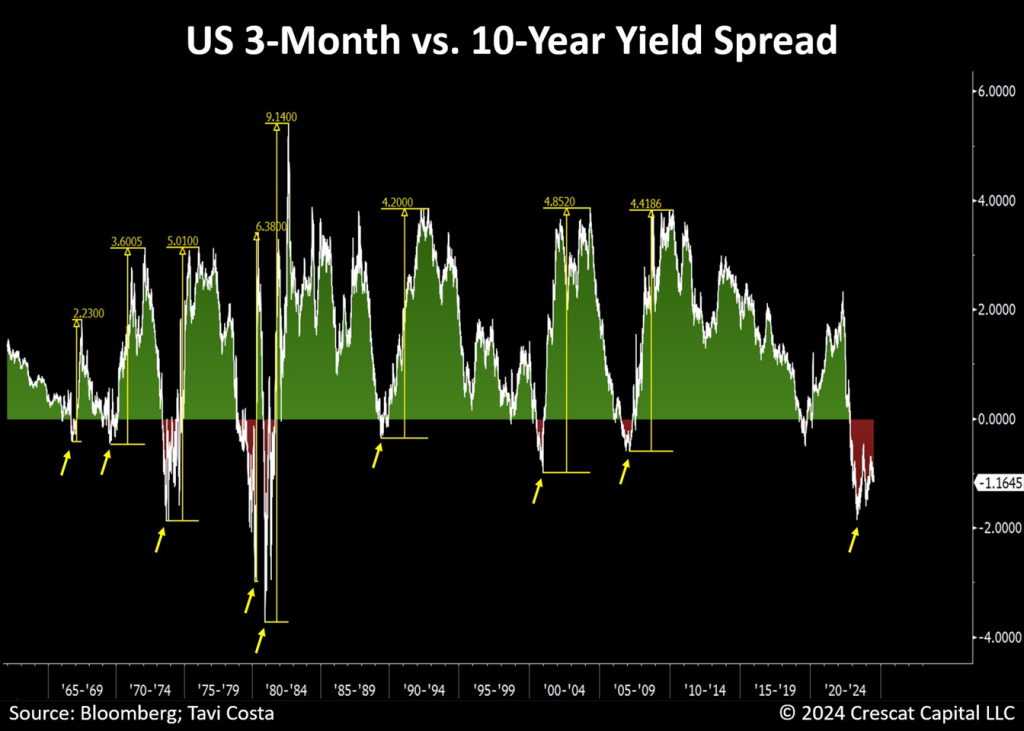
Occasionally, the Treasury markets present significant macro opportunities. In our view, this is potentially one of the most attractive setups we’ve seen. Following one of the deepest and longest-lasting yield curve inversions in history, the yield curve is likely poised for a major steepening move. Historically, such changes tend to occur abruptly and have been among the most reliable indicators of an impending recession. The chart below provides an important perspective, suggesting that this steepening move is likely still in its early stages.
Unsustainably Low Volatility
Examining the last three major steepening moves in the 2 vs. 30-year yield spread, each one coincided with a significant increase in volatility. We don’t believe this time will be any different. The overwhelming complacency of investors is precisely why we are concerned. That is also reflected in the excessive valuations we see in US equity markets.
No Longer Living in ZIRP
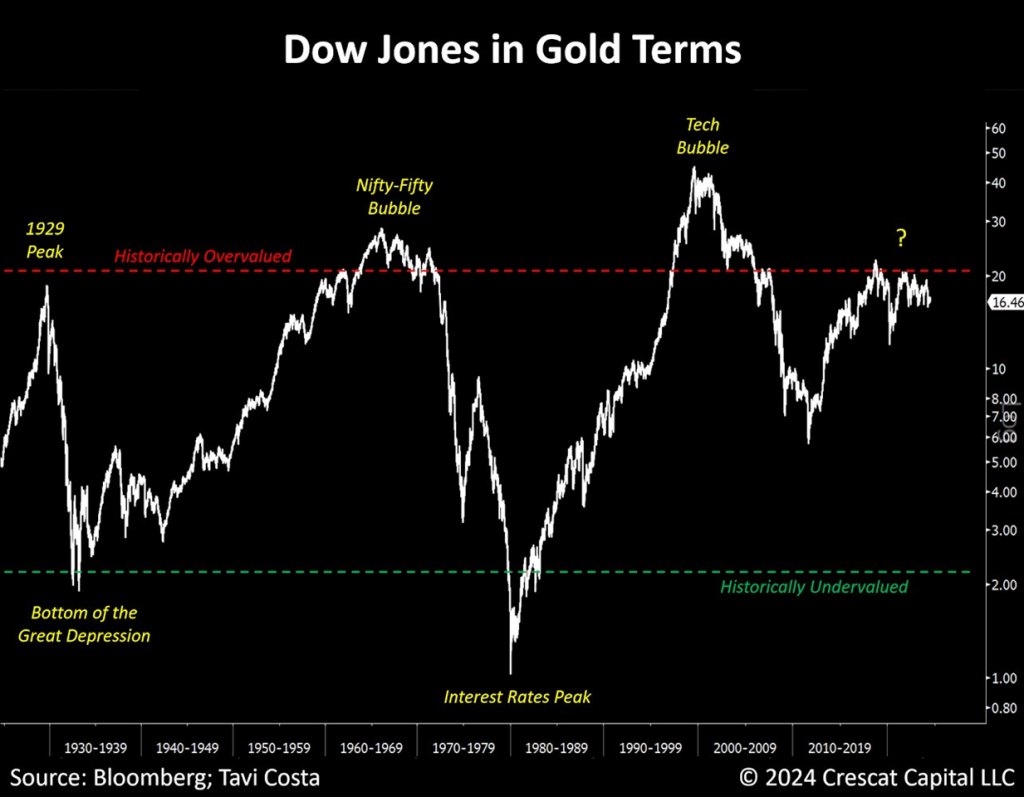
It amazes us that people overlook the fact that when adjusted for gold prices the US equity market has for some time now been as historically overvalued as it was at the 1929 peak levels and regard this as a new normal.
Investors’ overall concept of risk has been largely abandoned. Perhaps that could be justified when interest rates are near zero, propping up valuations to an extreme, but we no longer live in such an environment.
Note that this metric peaked a few years ago, a downward trend is now becoming increasingly apparent.
Volatility Appears Largely Mispriced
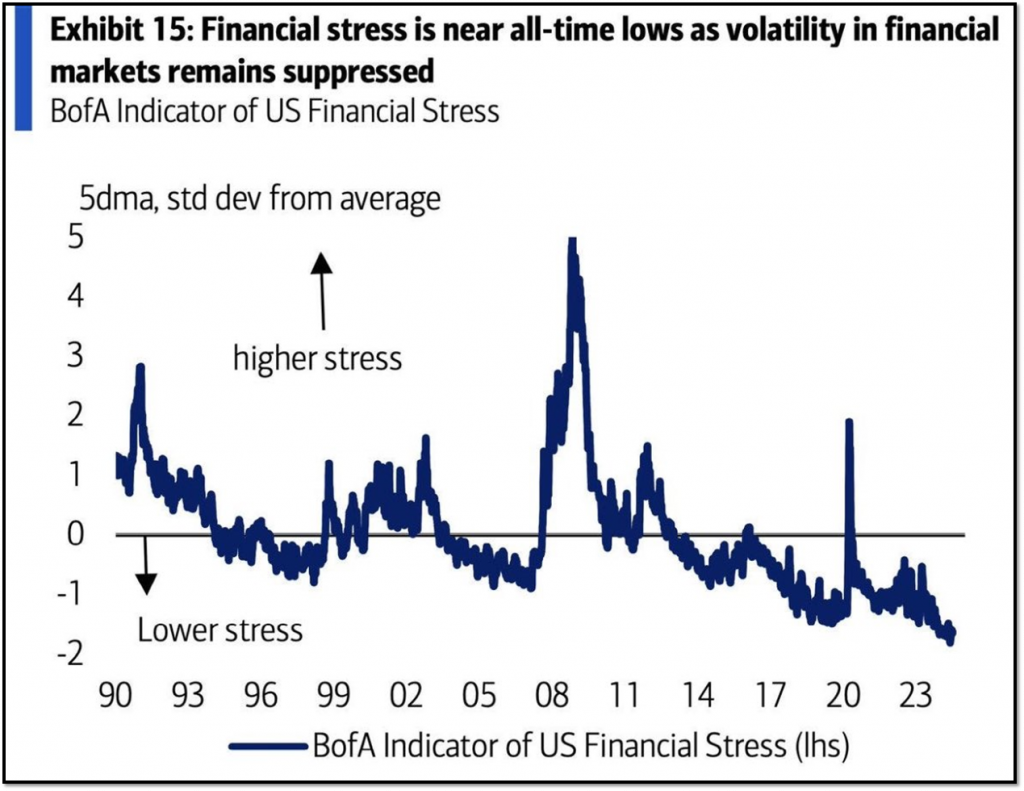
The extended period of near-zero interest rates has suppressed volatility and financial stress to historically low levels. The lagging effect of the recent rise in overall cost capital is normal, but the clock is ticking faster, and a significant change in the macro landscape seems highly likely in the near term.
The current unusually calm environment seems unsustainable and, in our view, poised for imminent change in market volatility.
A Critical Juncture for Equity Markets
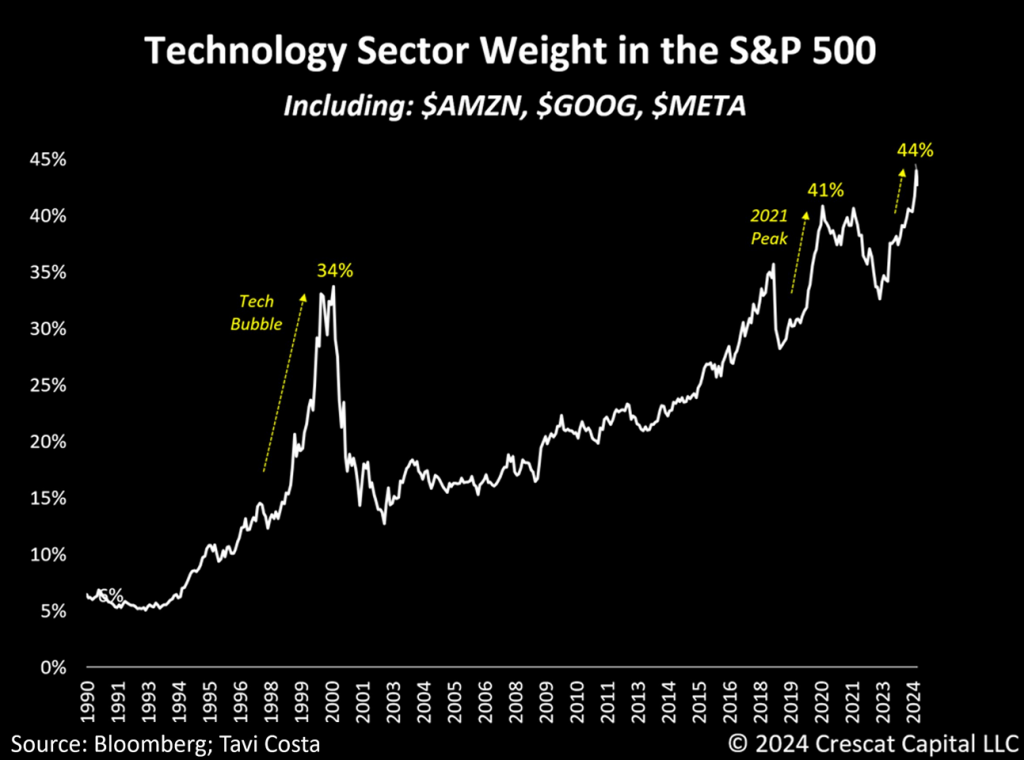
The tech sector now constitutes 44% of the S&P 500 index when including Amazon, Alphabet, and Meta. It wasn’t too long ago that these firms were considered part of the technology sector, and in our view, their core businesses remain technology driven.
The pendulum has probably swung too far in one direction, and investors are running out of ideas to justify these historic imbalances.
Unless “this time is different,” we are likely at a critical juncture for US equity markets.
Disclosure: Crescat may or may not hold positions at any given time in the securities referenced herein. This is not a recommendation or endorsement to buy or sell any security or other financial instrument.
Performance
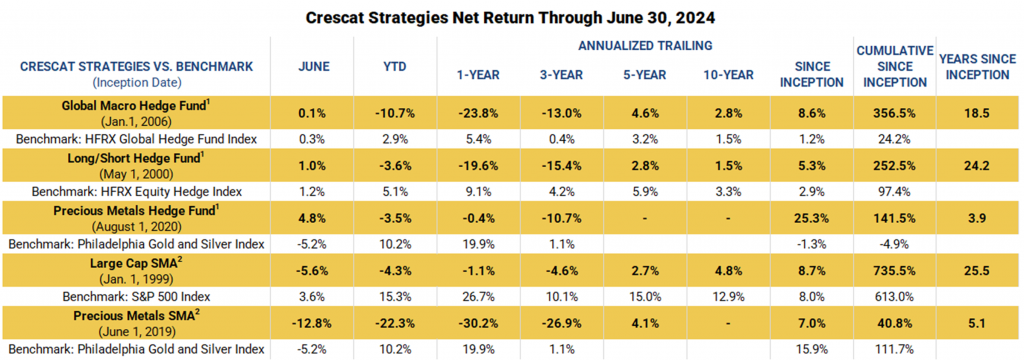
Performance data represents past performance, and past performance does not guarantee future results. Performance data is subject to revision following each monthly reconciliation and/or annual audit. Individual performance may be lower or higher than the performance data presented. The currency used to express performance is U.S. dollars. Before January 1, 2003, the results reflect accounts managed at a predecessor firm. See additional performance disclosures below.
We think the timing is potentially ideal for adding exposure to our strategies today given our well-vetted positioning ahead of the likely monumental macro regime shift discussed herein. We encourage you to reach out to any of us listed below if you would like to learn more about how our vehicles might fit with your individual needs and objectives.
Sincerely,
Kevin C. Smith, CFA
Founding Member & Chief Investment Officer
Tavi Costa
Member & Macro Strategist
Quinton T. Hennigh, PhD
Member & Geologic and Technical Director
For more information including how to invest, please contact:
Marek Iwahashi
Head of Investor Relations
miwahashi@crescat.net
(720) 323-2995
Linda Carleu Smith, CPA
Co-Founding Member & Chief Operating Officer
(303) 228-7371
© 2024 Crescat Capital LLC
Important Disclosures
The purpose of this letter is to provide access to analyses prepared by Crescat Portfolio Management LLC (“CPM”) with respect to certain companies (“Issuers”) in which CPM and certain of the Funds and accounts it manages are shareholders. The letters enable CPM to share macro themes and newsworthy geologic updates, good and bad, across our Issuers as they arise. The letters represent the opinions of CPM, as an exploration industry advocate, on the overall geologic progress of our activist strategy in creating new economic metal deposits in viable mining jurisdictions around the world. Each Issuer discussed has been selected solely for this purpose and has not been selected on the basis of performance or any performance-related criteria. The securities discussed herein do not represent an entire portfolio and in the aggregate may only represent a small percentage of a strategies holdings. The Issuers discussed may or may not be held in such portfolios at any given time. The Issuers discussed do not represent all of the investments purchased or sold by Funds managed by CPM. It should not be assumed that any or all of these investments were or will be profitable.
Projected results and statements contained in this letter that are not historical facts are based on current expectations and involve risks, uncertainties and other factors that may cause actual results, performance or achievements to be materially different from any future results. While investing in the mining industry is inherently risk, CPM believes that under a professionally managed portfolio approach with the guidance of Quinton Hennigh, PhD, CPM’s full-time Geologic and Technical Director, and our proprietary exploration and mining model, we will be able to generate long-term capital appreciation.
These opinions are current opinions as of the date appearing in the relevant material and are subject to change without notice. The information contained in the letters is based on publicly available information with respect to the Issuers as of the date of such white papers and has not been updated since such date.
This letter is not intended to be, nor should it be construed as, an offer to sell or a solicitation of an offer to buy any security. The information provided in this letter is not intended as investment advice or recommendation to buy or sell any type of investment, or as an opinion on, or a suggestion of, the merits of any particular investment strategy.
This letter is not intended to be, nor should it be construed as, a marketing or solicitation vehicle for CPM or its Funds. The information herein does not provide a complete presentation of the investment strategies or portfolio holdings of the Funds and should not be relied upon for purposes of making an investment or divestment decision with respect to the Funds. Those who are considering an investment in the Funds should carefully review the relevant Fund’s offering memorandum and the information concerning CPM, including its SEC Form ADV Brochure which is available at: www.adviserinfo.sec.gov.
This presentation should not be construed as legal, tax, investment, financial or other advice. It does not have regard to the specific investment objective, financial situation, suitability, or the particular need of any specific person who may receive this presentation and should not be taken as advice on the merits of any investment decision. The views expressed in this presentation represent the opinions of CPM and are based on publicly available information with respect to the Issuer. CPM recognizes that there may be confidential information in the possession of the Issuer that could lead the Issuer to disagree with CPM’s conclusions.
CPM currently beneficially owns, and/or has an economic interest in, shares of the Issuers discussed in these letters. Therefore, CPM’s clients, principals and employees may stand to realize significant gains or losses if the price of the companies’ securities move. After the publication or posting of any video, CPM, its principals and employees will continue transacting in the securities discussed, and may be long, short or neutral at any time thereafter regardless of their initial position or recommendation. While certain individuals affiliated with CPM are current or former directors of certain of the Issuers referred to herein, none of the information contained in this presentation or otherwise provided to you is derived from non-public information of such publicly traded companies. CPM has not sought or obtained consent from any third party to use any statements or information indicated herein that have been obtained or derived from statements made or published by such third parties.
The estimates, projections, pro forma information and potential impact of CPM’s analyses set forth herein are based on assumptions that CPM believes to be reasonable as of the date of this presentation, but there can be no assurance or guarantee (i) that any of the proposed actions set forth in this presentation will be completed, (ii) that actual results or performance of the Issuer will not differ, and such differences may be material or (iii) that any of the assumptions provided in this presentation are accurate.
All content posted on CPM’s letters including graphics, logos, articles, and other materials, is the property of CPM or others and is protected by copyright and other laws. All trademarks and logos are the property of their respective owners, who may or may not be affiliated with CPM. Nothing contained on CPM’s website or social media networks should be construed as granting, by implication, estoppel, or otherwise, any license or right to use any content or trademark displayed on any site without the written permission of CPM or such other third party that may own the content or trademark displayed on any site.
Performance
Performance data represents past performance, and past performance does not guarantee future results. Performance data is subject to revision following each monthly reconciliation and/or annual audit. Individual performance may be lower or higher than the performance data presented. The currency used to express performance is U.S. dollars. Before January 1, 2003, the results reflect accounts managed at a predecessor firm.
1 – Net returns reflect the performance of an investor who invested from inception and is eligible to participate in new issues. Net returns reflect the reinvestment of dividends and earnings and the deduction of all expenses and fees (including the highest management fee and incentive allocation charged, where applicable). An actual client’s results may vary due to the timing of capital transactions, high watermarks, and performance.
2 – The SMA composites include all accounts that are managed according to CPM’s precious metals or large cap SMA strategy over which it has full discretion. Investment results shown are for taxable and tax-exempt accounts. Any possible tax liabilities incurred by the taxable accounts are not reflected in net performance. Performance results are time weighted and reflect the deduction of advisory fees, brokerage commissions, and other expenses that a client would have paid, and includes the reinvestment of dividends and other earnings.
Risks of Investment Securities: Diversity in holdings is an important aspect of risk management, and CPM works to maintain a variety of themes and equity types to capitalize on trends and abate risk. CPM invests in a wide range of securities depending on its strategies, as described above, including but not limited to long equities, short equities, mutual funds, ETFs, commodities, commodity futures contracts, currency futures contracts, fixed income futures contracts, private placements, precious metals, and options on equities, bonds and futures contracts. The investment portfolios advised or sub-advised by CPM are not guaranteed by any agency or program of the U.S. or any foreign government or by any other person or entity. The types of securities CPM buys and sells for clients could lose money over any timeframe. CPM’s investment strategies are intended primarily for long-term investors who hold their investments for substantial periods of time. Prospective clients and investors should consider their investment goals, time horizon, and risk tolerance before investing in CPM’s strategies and should not rely on CPM’s strategies as a complete investment program for all of their investable assets. Of note, in cases where CPM pursues an activist investment strategy by way of control or ownership, there may be additional restrictions on resale including, for example, volume limitations on shares sold. When CPM’s private investment funds or SMA strategies invest in the precious metals mining industry, there are particular risks related to changes in the price of gold, silver and platinum group metals. In addition, changing inflation expectations, currency fluctuations, speculation, and industrial, government and global consumer demand; disruptions in the supply chain; rising product and regulatory compliance costs; adverse effects from government and environmental regulation; world events and economic conditions; market, economic and political risks of the countries where precious metals companies are located or do business; thin capitalization and limited product lines, markets, financial resources or personnel; and the possible illiquidity of certain of the securities; each may adversely affect companies engaged in precious metals mining related businesses. Depending on market conditions, precious metals mining companies may dramatically outperform or underperform more traditional equity investments. In addition, as many of CPM’s positions in the precious metals mining industry are made through offshore private placements in reliance on exemption from SEC registration, there may be U.S. and foreign resale restrictions applicable to such securities, including but not limited to, minimum holding periods, which can result in discounts being applied to the valuation of such securities. In addition, the fair value of CPM’s positions in private placements cannot always be determined using readily observable inputs such as market prices, and therefore may require the use of unobservable inputs which can pose unique valuation risks. Furthermore, CPM’s private investment funds and SMA strategies may invest in stocks of companies with smaller market capitalizations. Small- and medium-capitalization companies may be of a less seasoned nature or have securities that may be traded in the over-the-counter market. These “secondary” securities often involve significantly greater risks than the securities of larger, better-known companies. In addition to being subject to the general market risk that stock prices may decline over short or even extended periods, such companies may not be well-known to the investing public, may not have significant institutional ownership and may have cyclical, static or only moderate growth prospects. Additionally, stocks of such companies may be more volatile in price and have lower trading volumes than larger capitalized companies, which results in greater sensitivity of the market price to individual transactions. CPM has broad discretion to alter any of the SMA or private investment fund’s investment strategies without prior approval by, or notice to, CPM clients or fund investors, provided such changes are not material.
Benchmarks
HFRX GLOBAL HEDGE FUND INDEX. The HFRX Global Hedge Fund Index represents a broad universe of hedge funds with the capability to trade a range of asset classes and investment strategies across the global securities markets. The index is weighted based on the distribution of assets in the global hedge fund industry. It is a tradeable index of actual hedge funds. It is a suitable benchmark for the Crescat Global Macro private fund which has also traded in multiple asset classes and applied a multi-disciplinary investment process since inception.
HFRX EQUITY HEDGE INDEX. The HFRX Equity Hedge Index represents an investable index of hedge funds that trade both long and short in global equity securities. Managers of funds in the index employ a wide variety of investment processes. They may be broadly diversified or narrowly focused on specific sectors and can range broadly in terms of levels of net exposure, leverage employed, holding periods, concentrations of market capitalizations and valuation ranges of typical portfolios. It is a suitable benchmark for the Crescat Long/Short private fund, which has also been predominantly composed of long and short global equities since inception.
PHILADELPHIA STOCK EXCHANGE GOLD AND SILVER INDEX. The Philadelphia Stock Exchange Gold and Silver Index is the longest running index of global precious metals mining stocks. It is a diversified, capitalization-weighted index of the leading companies involved in gold and silver mining. It is a suitable benchmark for the Crescat Precious Metals private fund and the Crescat Precious Metals SMA strategy, which have also been predominately composed of precious metals mining companies involved in gold and silver mining since inception.
S&P 500 INDEX. The S&P 500 Index is perhaps the most followed stock market index. It is considered representative of the U.S. stock market at large. It is a market cap-weighted index of the 500 largest and most liquid companies listed on the NYSE and NASDAQ exchanges. While the companies are U.S. based, most of them have broad global operations. Therefore, the index is representative of the broad global economy. It is a suitable benchmark for the Crescat Global Macro and Crescat Long/Short private funds, and the Large Cap and Precious Metals SMA strategies, which have also traded extensively in large, highly liquid global equities through U.S.-listed securities, and in companies Crescat believes are on track to achieve that status. The S&P 500 Index is also used as a supplemental benchmark for the Crescat Precious Metals private fund and Precious Metals SMA strategy because one of the long-term goals of the precious metals strategy is low correlation to the S&P 500.
References to indices, benchmarks or other measures of relative market performance over a specified period of time are provided for your information only. Reference to an index does not imply that the fund or separately managed account will achieve returns, volatility or other results similar to that index. The composition of an index may not reflect the manner in which a portfolio is constructed in relation to expected or achieved returns, portfolio guidelines, restrictions, sectors, correlations, concentrations, volatility or tracking.
Separately Managed Account (SMA) disclosures: The Crescat Large Cap Composite and Crescat Precious Metals Composite include all accounts that are managed according to those respective strategies over which the manager has full discretion. SMA composite performance results are time-weighted net of all investment management fees and trading costs including commissions and non-recoverable withholding taxes. Investment management fees are described in CPM’s Form ADV 2A. The manager for the Crescat Large Cap strategy invests predominantly in equities of the top 1,000 U.S. listed stocks weighted by market capitalization. The manager for the Crescat Precious Metals strategy invests predominantly in a global all-cap universe of precious metals mining stocks.
Hedge Fund disclosures: Only accredited investors and qualified clients will be admitted as limited partners to a CPM hedge fund. For natural persons, investors must meet SEC requirements including minimum annual income or net worth thresholds. CPM’s hedge funds are being offered in reliance on an exemption from the registration requirements of the Securities Act of 1933 and are not required to comply with specific disclosure requirements that apply to registration under the Securities Act. The SEC has not passed upon the merits of or given its approval to CPM’s hedge funds, the terms of the offering, or the accuracy or completeness of any offering materials. A registration statement has not been filed for any CPM hedge fund with the SEC. Limited partner interests in the CPM hedge funds are subject to legal restrictions on transfer and resale. Investors should not assume they will be able to resell their securities. Investing in securities involves risk. Investors should be able to bear the loss of their investment. Investments in CPM’s hedge funds are not subject to the protections of the Investment Company Act of 1940.
Investors may obtain the most current performance data, private offering memoranda for CPM’s hedge funds, and information on CPM’s SMA strategies, including Form ADV Part 2 and 3, by contacting Linda Smith at (303) 271-9997 or by sending a request via email to lsmith@crescat.net. See the private offering memorandum for each CPM hedge fund for complete information and risk factors.