What if the rate of inflation is in the process of bottoming out and the Federal Reserve has limited capacity to intervene to contain it?
Monetary policy is increasingly evolving into a crucial tool for reducing interest payments on government debt, thus allowing fiscal stimulus to be more strategically channeled towards fostering economic growth, in our opinion. A key factor behind the exceptional economic performance of the United States over the past decade, particularly when compared to the rest of the world, has been its ability to deploy substantial fiscal spending to stimulate real GDP growth. This capacity is underpinned by the dollar’s role as the global reserve currency, which has granted the US a unique privilege to operate with less fiscal discipline for longer periods than other nations.
Our primary concern, however, is that the rising share of interest payments and entitlement spending pose a serious challenge to the sustainability of this dynamic. Such non-growth oriented expenditures have surged significantly, now making up 55% of fiscal spending — the highest level in nearly 40 years.
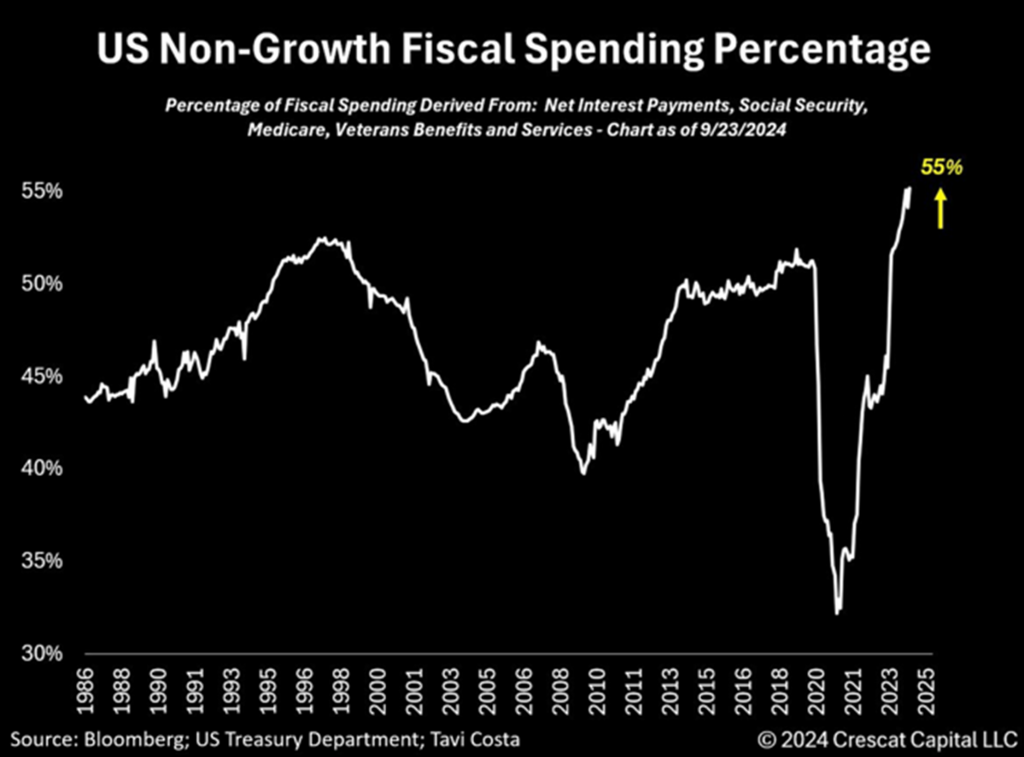
Non-Growth Government Spending Erodes Real GDP Growth
To understand the challenge of stimulating real GDP growth through fiscal policy, i.e., government spending, we consider a framework in which the government has two primary levers:
- It can further increase overall spending to offset the increase in the share of its non-productive growth expenditures; and/or
- It can attempt to reduce interest rates to release more of its existing relative outlay toward growth-oriented initiatives versus debt servicing.
Both strategies could be implemented concurrently, and each is inherently inflationary in our assessment. Maintaining current spending patterns risks allowing these unproductive expenditures to consume an even larger share of the fiscal budget, potentially undermining one of the key engines of America’s growth which we characterize as fiscal exceptionalism.
The preceding framework may offer some clarity on why the Federal Reserve may have adopted such aggressive interest rate cuts, despite what we believe is a lack of comprehensive economic data to support the fulfillment of its mandate on the inflation front. Although no policymaker would openly concede it, the most plausible rationale for Fed rate cuts, in our view, is that rising interest payments are increasingly consuming the beneficial effects of an increase in government spending.
Compounding the issue are the current twin budget and trade deficits, which have worsened to 10% combined of US nominal GDP. These deficits stand in stark contrast to an interest rate policy that is already low in comparison at 5% on the target Fed Funds rate. Meanwhile, market participants and the Fed expect this rate to go a full two percentage points lower over the next 9 months with a rate cut at each of the next six Fed meetings.
To put the US’s overall fiscal health into perspective, imagine a company with stagnant sales growth for the last two years, with net losses of around 10% of those revenues that is relying on new borrowing to stay afloat while already carrying record levels of debt relative to revenues.
Unlike a typical business, the government has unlimited capacity to expand its monetary base to avoid a technical default. This dynamic likely explains why many foreign central banks have been shifting toward gold over US Treasuries.
We anticipate that a further Fed-driven reduction in the cost of debt is not only likely but perhaps unavoidable. This scenario, in our view, sets the stage for continued dollar weakness, even against other fiat currencies— a perspective that remains largely unpopular.
According to the OECD, net interest payments are projected to reach approximately 4.6% of GDP by 2025, significantly exceeding levels seen in other developed economies. We believe this situation puts the Federal Reserve under urgent pressure to considerably reduce its cost of debt compared to other central banks, which could have a substantial effect on the dollar’s value against other currencies.
On the other hand, the Fed’s recent decision to loosen monetary policy, despite financial conditions—defined as the overall state of financial markets, including interest rates, asset prices, and credit availability—already being the most accommodative in the past two years, could provide a significant macroeconomic boost and potentially rekindle inflationary pressures.
In our opinion, now is not the time to take a bearish stance on commodities, especially cyclical ones like oil and copper, which typically benefit from a resurgence in inflation.
It is profoundly important to observe what has been happening with inflation expectations since policymakers reduced interest rates by 0.5%. US breakeven rates, for instance, have only risen since then. However, the critical question for capital allocation over the next 1-3 years is:
If inflation accelerates again, can the Federal Reserve respond, given that interest payments to GDP are already at their highest in 200 years? Our answer is likely no.
If so, this macro environment could create a historically significant tailwind for hard assets — rising inflation while policymakers are limited in their ability to raise interest rates.
A key indicator of inflation is the comprehensive assessment of money and credit within the economy. Logically, when this measurement exceeds normal levels, inflationary pressures become more pronounced. Observe in the chart below how global money supply is beginning to rise once more, having increased by $7.3 trillion over the past year—representing the highest growth rate in two years. We believe this rebound in money supply growth is poised to lead to additional inflationary challenges.
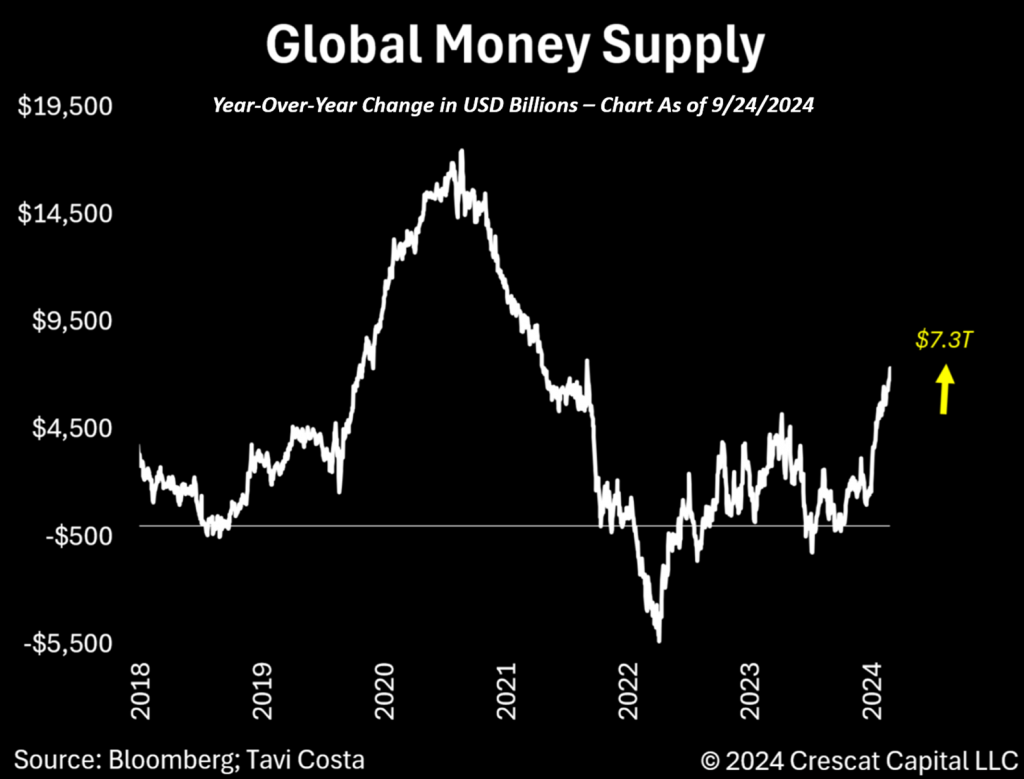
Disclosure: Global Money Supply as referenced in the above chart is defined in ‘Benchmark’ section below.
A Primary Inflation Signal
The correlation between money supply and the consumer price index has become increasingly evident, particularly over the past decade, marked by substantial credit expansion. The accompanying chart illustrates the historical relationship between these two economic indicators, highlighting their interconnection.
In the aftermath of the Global Financial Crisis of 2008, the subsequent years witnessed inflation predominantly reflected in financial asset prices rather than in significant increases in overall consumer prices. This phenomenon is believed to be attributed, in part, to the peak in commodity markets observed in 2011, following a prolonged period characterized by speculative excess in resource sectors and the misallocation of assets at unsustainable valuations. Today, we find ourselves in a contrasting scenario in our view.
In our opinion, a primary driver of the fiscal and monetary stimulus implemented over recent years—continuing today as money supply accelerates worldwide—has been the inherent upward pressure on commodity prices, which likely reached a historical bottom during the pandemic-induced market crash. We believe the likely increase in natural resource prices may serve as a critical contributing factor to the inflation narrative anticipated in the coming decade.
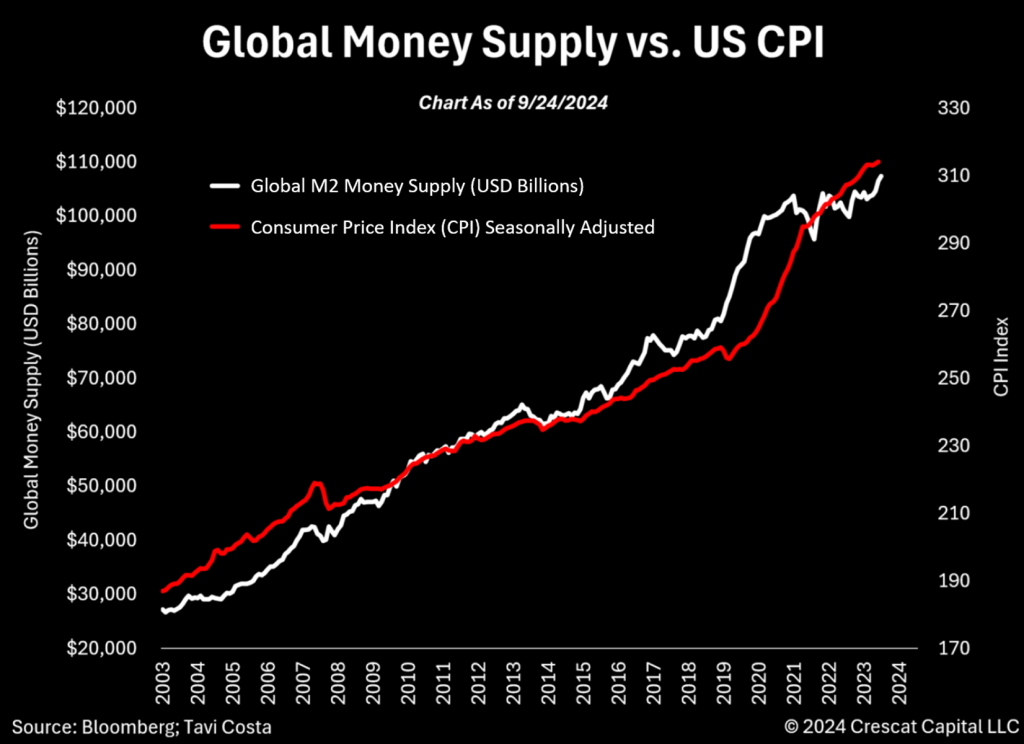
Disclosure: Indices referenced in the above chart are defined in ‘Benchmark’ section below.
The Role of Commodities in Driving Inflation
To provide further clarity in this analysis, it is essential to acknowledge that, while the expansion of money supply is commonly regarded as a major driver of inflation, recent trends in agricultural commodities warrant careful attention in our view.
Their significant upward trend carries profound implications for food prices, disproportionately affecting consumers at the lower end of the economic spectrum. As illustrated in the chart, there is also a notable divergence between the performance of agricultural commodities and the broader commodity complex. This divergence is particularly important, as the inherent interconnectedness of natural resources suggests that the current trajectory in agricultural commodities may serve as a leading indicator for future movements in the broader commodity market.
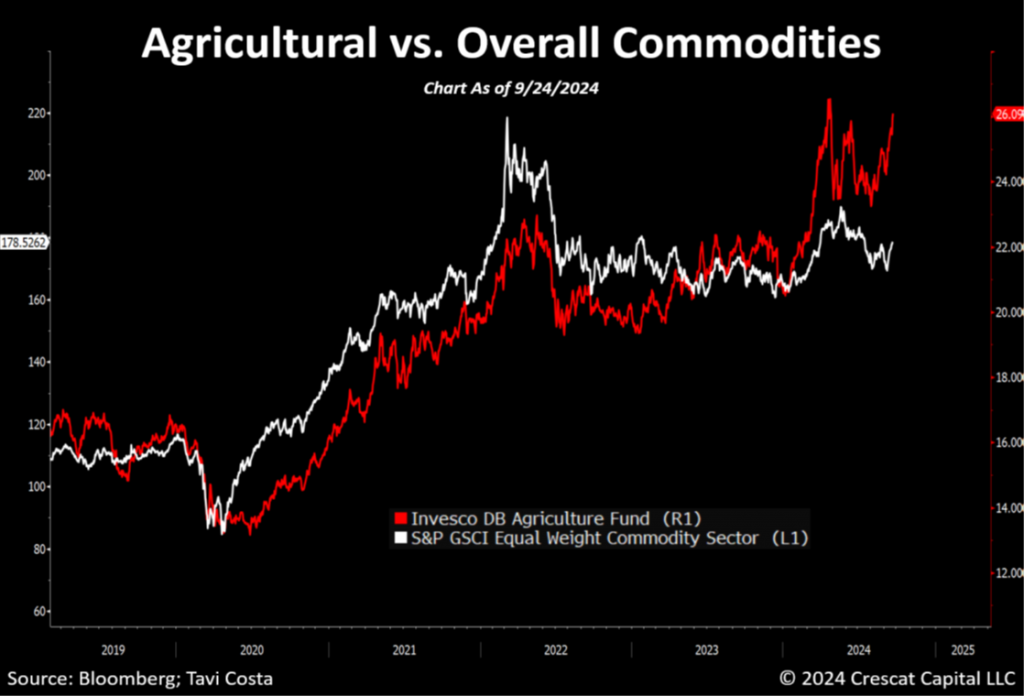
Disclosure: The Fund and Index referenced in the above chart are defined in ‘Benchmark’ section below. This is not a recommendation or endorsement to buy or sell any security or other financial instrument.
Rotational Trends in Commodity Markets
A compelling approach to identifying the beginning of a new secular trend in commodities is to examine the rotational dynamics of price behavior among various resources. Instead of witnessing uniformly depressed prices across the board, we often observe significant surges in certain commodities, which investors tend to attribute to unique reasons. In reality, these price spikes are frequently interconnected. It is important to note that during a commodities cycle, there is often a particular resource that becomes the “flavor of the day”. For example, currently, gold and sugar are in the spotlight; three months ago, it was copper and cocoa; while last year, orange juice took center stage. In 2022, energy commodities were prominent, and in 2021, we saw notable interest in lumber, coal, and lithium.
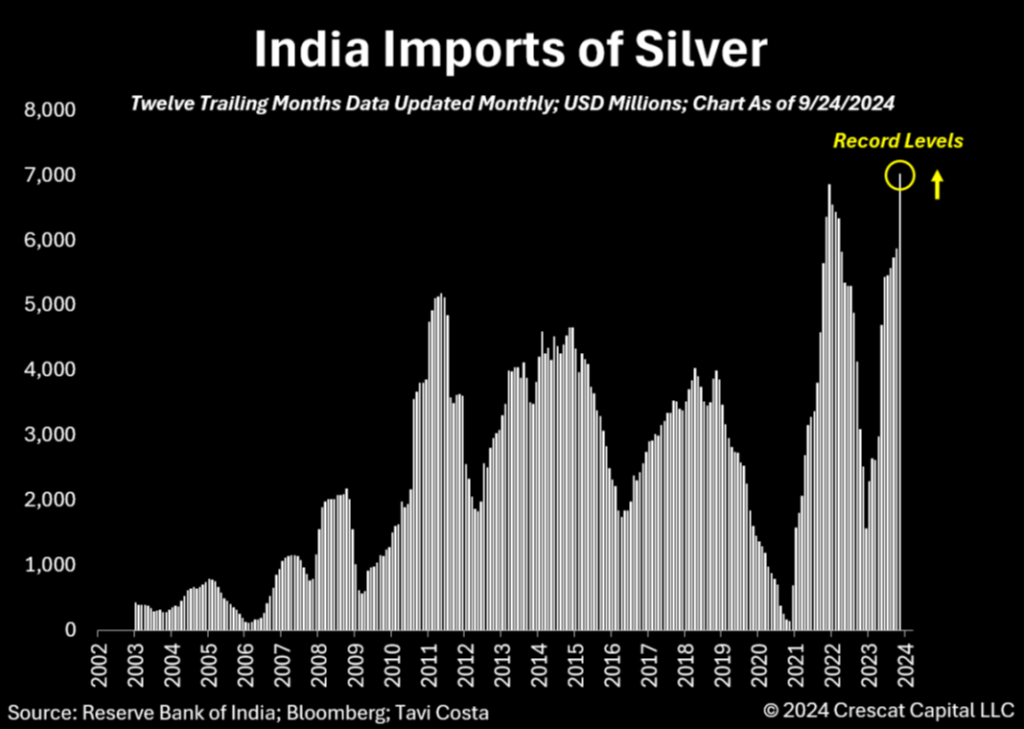
We believe that silver is poised to be one of the next commodities to attract significant capital interest. Widespread investor skepticism surrounding the metal remains, but in our opinion, silver presents one of the most bullish supply-demand mismatches we’ve ever seen on the industrial front particularly given growing photovoltaic demand with the opportunity for investment sentiment to also improve substantially. Meanwhile, very little capital has been allocated to developing new silver mines over the past decade with a notable absence of significant new discoveries worldwide, outside of those in Crescat’s portfolio. We believe the macro thesis for silver remains incredibly compelling.
The chart below highlights India, one of the few countries that deeply values the purchase of precious metals, both as jewelry and as a hedge against inflation. Currently, India is importing these metals at record levels. It’s important to note that the chart is in US dollar terms, underscoring that the volume of recent purchases in terms of silver ounces is significantly higher than in the 2011 peak because prices are lower now than they were then.
Disclosure: Crescat may or may not hold positions at any given time in the securities referenced herein. This is not a recommendation or endorsement to buy or sell any security or other financial instrument.
Gold Often Foreshadows Copper
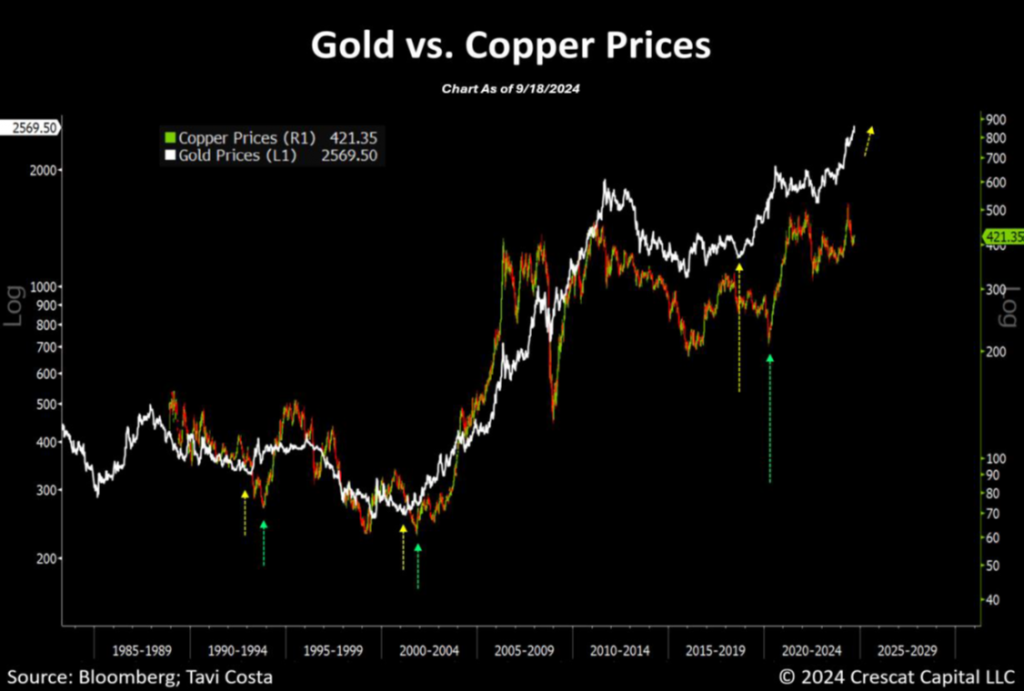
As illustrated in the chart below, historical patterns show that key inflection points in base metals have often been preceded by a notable increase in gold prices. It is important to consider that, despite copper’s cyclical nature, when a secular trend in precious metals emerges, other metals tend to follow suit, as seen in past commodity cycles during the early 2000s and the 1970s.
While each metal has distinct macroeconomic factors underpinning its value, gold frequently leads these movements, particularly on the upside, due to its status as a haven asset. This attribute tends to instill greater confidence among investors, prompting initial capital allocation toward gold. Once a secular move in gold is established, investors tend to diversify into higher-risk assets, such as copper, which typically experiences stronger upside potential but also significant downside risk. We believe copper is currently undervalued, both in terms of its future supply constraints and the increasing global demand driven by construction and industrial activity. Furthermore, copper’s pivotal role in the transformation of the electric grid—essential for supporting artificial intelligence, the green energy transition, and expanding global industrial capacity—makes it one of the most critical metals in the modern economy.
In our opinion, the recent rally in gold prices could serve as an early indicator of what may be on the horizon for base metals.
Disclosure: Crescat may or may not hold positions at any given time in the securities referenced herein. This is not a recommendation or endorsement to buy or sell any security or other financial instrument.
A Legacy Industry Poised for Secular Growth
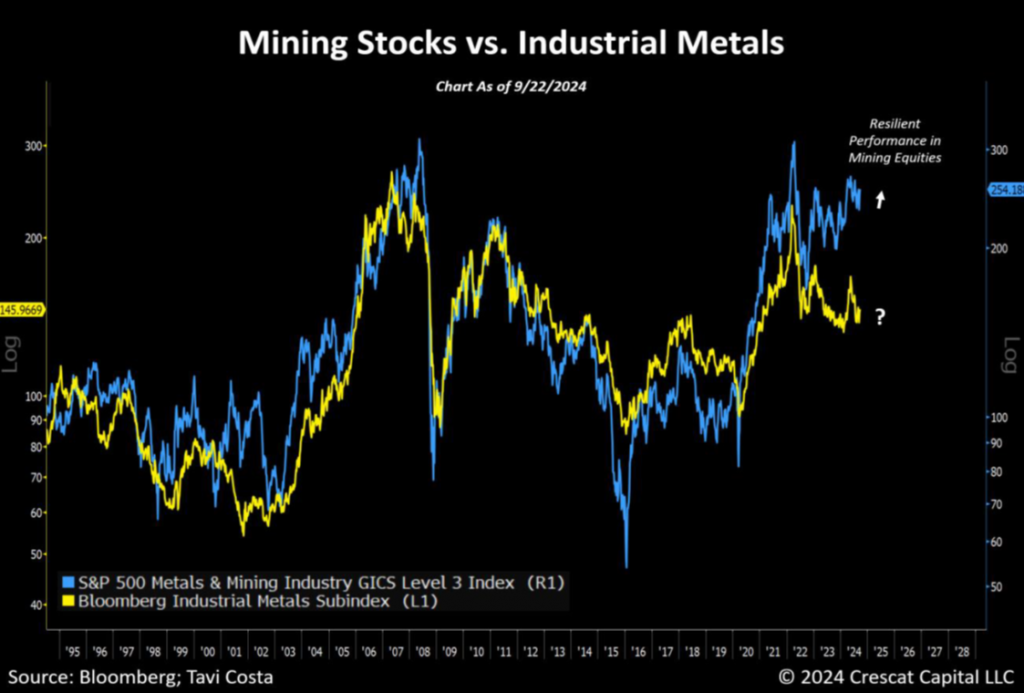
The mining industry is, in our assessment, at a critical juncture. It is particularly important to observe when mining companies display resilience despite downward pressure on their underlying metal prices. The substantial operating leverage of these companies often results in their stocks reacting disproportionately to fluctuations in metal prices, either positively or negatively. The outperformance of mining equities since January 2023, even amidst broad-based weakness in industrial metals, indicates that long-term investors may be beginning to appreciate the inherent value and opportunities within the sector, despite the usual volatility associated with metal markets.
There are numerous strategies for capital allocation within the investment sector; however, one of Crescat’s preferred approaches involves identifying undervalued businesses that offer secular growth potential, often overlooked due to historically depressed fundamental multiples. We contend that mining strongly fits this criterion. The prevailing negative sentiment and investor neglect toward these companies have resulted in a significant lack of capital interest, which is now evident in the inefficiencies plaguing this industry.
Mining is among the oldest and most essential industries in the history and development of humanity, with evidence of prehistoric mining activities dating back approximately 2.6 million years. We are highly confident that this industry will not disappear in the foreseeable future. To the contrary, in our analysis, it is as critical as ever for the advancement of modern civilization given the rising demand for onshoring, electric vehicles, artificial intelligence, the green revolution, including metal-hungry demand for renewable power through solar and wind, and the urgent need to upgrade electrical grids to facilitate all of these developments. From our viewpoint, these factors present some of the most compelling reasons to invest in the metals and mining industry for the next decade.
We believe that we may be approaching a critical turning point for mining equity investment, which typically experiences prolonged cycles—both bullish and bearish—due to its capital expenditure trends and the extended timeframe required to generate new supply.
Over the past 55 years, this sector has undergone two secular markets: from 1970 to 1980 and from 2000 to 2011. We believe that we are on the brink of entering another favorable phase.
Disclosure: Indices referenced in the above chart are defined in ‘Benchmark’ section below. Crescat may or may not hold positions at any given time in the securities referenced herein. This is not a recommendation or endorsement to buy or sell any security or other financial instrument.
The Diminishing Force of the Copper Gorilla
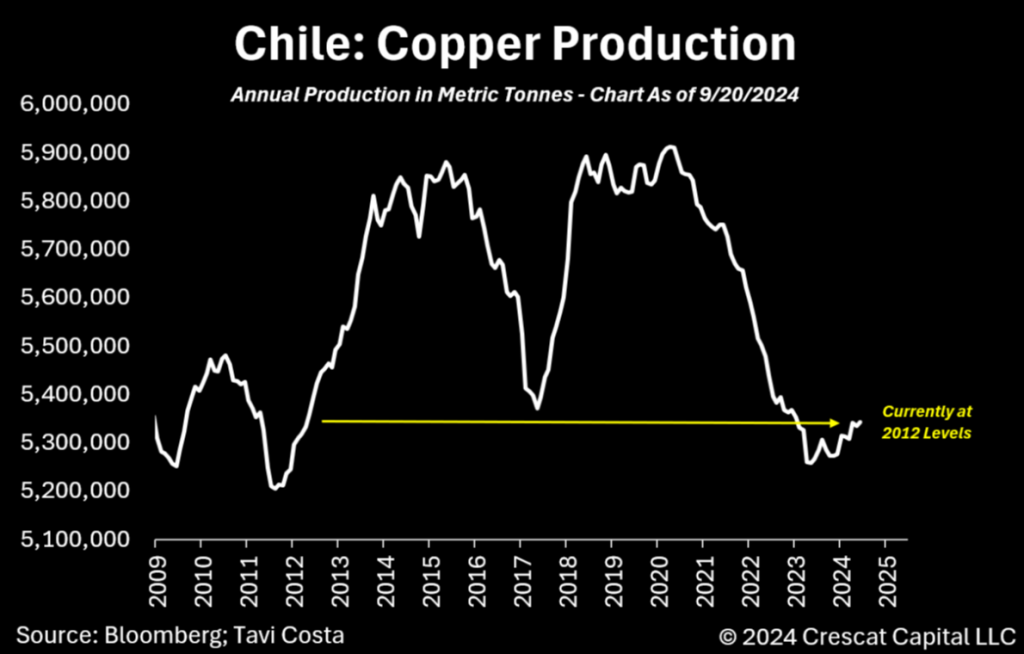
Chile’s annual copper production remains at the same level it was over a decade ago. As a reminder, Chile accounts for nearly one-third of the world’s copper production. In our view, this is a critical factor that likely sets the stage for a significant supply and demand mismatch as capital continues to flow into data centers, industrial and manufacturing capabilities, the modernization of electrical grids, green energy infrastructure, and onshoring efforts.
These dynamics may likely create substantial macro tailwinds for copper demand, while new supply continues to struggle due to the declining capital investment in the development of new copper mines.
Disclosure: Crescat may or may not hold positions at any given time in the securities referenced herein. This is not a recommendation or endorsement to buy or sell any security or other financial instrument.
Embracing a New Macro Cycle
A common belief is that mining companies will not benefit from a rising metal prices environment. Strong convictions often develop after long periods of consistent market movements, which shape people’s views based on their experiences in a particular macro context.
However, history shows that market leadership can change significantly every few decades. At times, emerging markets outperform developed countries, while other periods see technology sectors attracting the majority of capital, leading to inflated valuations and high fundamental multiples. These trends, however, are not permanent, highlighting the cyclical nature of markets.
While it may take time for capital allocators to recognize a major shift in market leadership, such changes are likely already underway, in our opinion. We are seeing natural resources perform better than they did five years ago, emerging markets showing resilience, value stocks beginning to gain traction, US Treasuries under pressure, and the dollar is no longer appreciating as much on down days. Despite this, technology companies remain at historically high valuations and continue to draw significant investor interest, a trend we believe is likely to change as well. Nonetheless, it is essential to recognize the seemingly underappreciated positive changes in the fundamentals of businesses that continue to operate under prevailing negative sentiment.
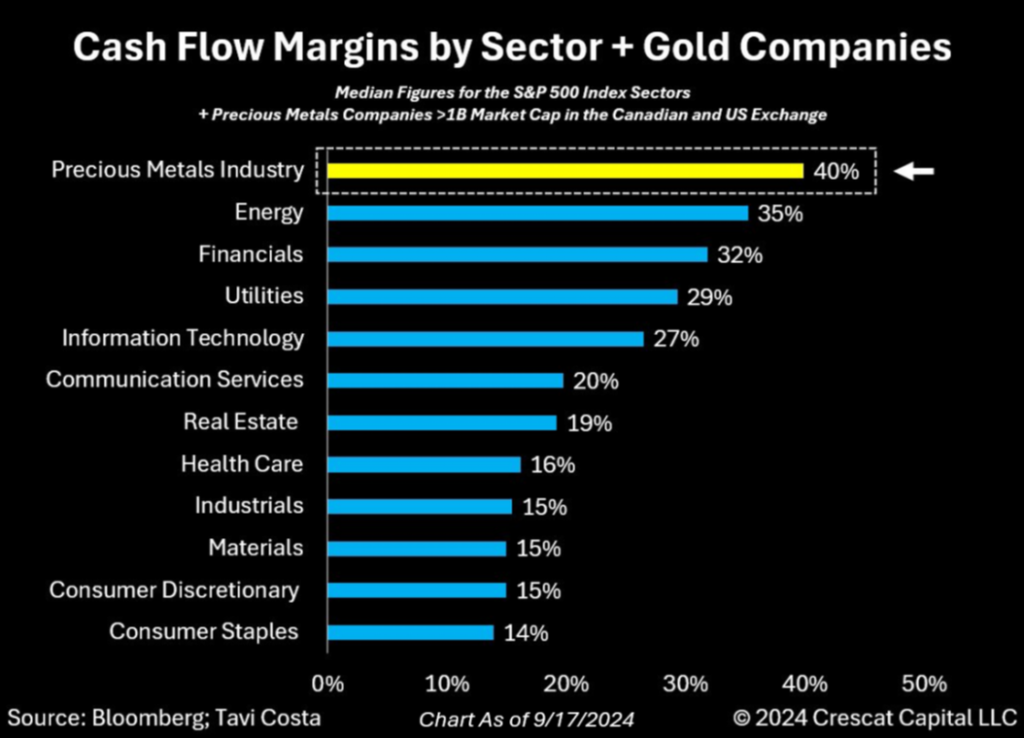
As represented in the chart below, if precious metals companies were a sector, they would have the highest cash flow margins in the S&P 500 index today.
Unlike previous decades, we believe the metals and mining industry companies, are poised to benefit substantially from what seems to be the nascent stages of a commodities cycle particularly for companies focused on gold, silver as well as copper and zinc.
As previously noted, it is essential to monitor the capital spending cycle of resource companies, as this often serves as a reliable indicator of our position within the overall cycle. When firms engage in excessive spending and a frenetic merger and acquisition environment emerges, caution is warranted. Such scenarios often lead to overpayment for projects and significant misallocation of capital.
In contrast, the current state of the commodity sector appears far removed from those extremes. Although some acquisitions have begun to occur, companies are maintaining historically low levels of capital expenditure, de-leveraged and healthy balance sheets, and, crucially, minimal emphasis on growth.
Paradoxically, while these factors may seem indicative of structural weaknesses, the commodities sector frequently benefits from a conservative approach. Given that resource industries typically experience long-term cyclical fluctuations, we believe we are witnessing the early stages of a new secular bull market.
Disclosure: Crescat may or may not hold positions at any given time in the securities referenced herein. This is not a recommendation or endorsement to buy or sell any security or other financial instrument.
Performance
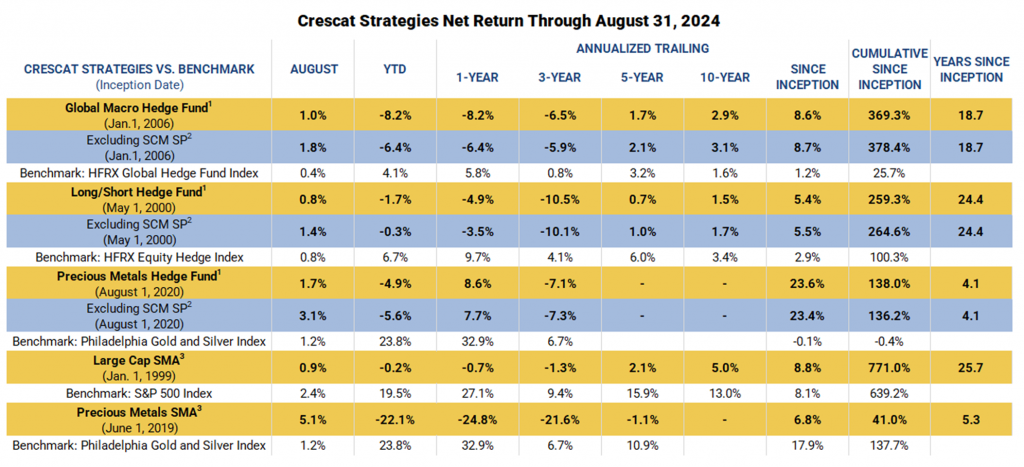
Performance data represents past performance, and past performance does not guarantee future results. Performance data is subject to revision following each monthly reconciliation and/or annual audit. Individual performance may be lower or higher than the performance data presented. The currency used to express performance is U.S. dollars. Before January 1, 2003, the results reflect accounts managed at a predecessor firm. See additional performance disclosures below.
We encourage you to reach out to any of us listed below if you would like to learn more about how our vehicles might fit with your individual needs and objectives.
Sincerely,
Kevin C. Smith, CFA
Founding Member & Chief Investment Officer
Tavi Costa
Member & Macro Strategist
Quinton T. Hennigh, PhD
Member & Geologic and Technical Director
For more information including how to invest, please contact:
Marek Iwahashi
Head of Investor Relations
(720) 323-2995
Linda Carleu Smith, CPA
Co-Founding Member & Chief Operating Officer
(303) 228-7371
© 2024 Crescat Capital LLC
Important Disclosures
The purpose of this letter is to provide access to analyses prepared by Crescat Portfolio Management LLC (“CPM”) with respect to certain companies (“Issuers”) in which CPM and certain of the Funds and accounts it manages are shareholders. The letters enable CPM to share macro themes and newsworthy geologic updates, good and bad, across our Issuers as they arise. The letters represent the opinions of CPM, as an exploration industry advocate, on the overall geologic progress of our activist strategy in creating new economic metal deposits in viable mining jurisdictions around the world. Each Issuer discussed has been selected solely for this purpose and has not been selected on the basis of performance or any performance-related criteria. The securities discussed herein do not represent an entire portfolio and in the aggregate may only represent a small percentage of a strategies holdings. The Issuers discussed may or may not be held in such portfolios at any given time. The Issuers discussed do not represent all of the investments purchased or sold by Funds managed by CPM. It should not be assumed that any or all of these investments were or will be profitable.
Projected results and statements contained in this letter that are not historical facts are based on current expectations and involve risks, uncertainties and other factors that may cause actual results, performance or achievements to be materially different from any future results. While investing in the mining industry is inherently risk, CPM believes that under a professionally managed portfolio approach with the guidance of Quinton Hennigh, PhD, CPM’s full-time Geologic and Technical Director, and our proprietary exploration and mining model, we will be able to generate long-term capital appreciation.
These opinions are current opinions as of the date appearing in the relevant material and are subject to change without notice. The information contained in the letters is based on publicly available information with respect to the Issuers as of the date of such white papers and has not been updated since such date.
This letter is not intended to be, nor should it be construed as, an offer to sell or a solicitation of an offer to buy any security. The information provided in this letter is not intended as investment advice or recommendation to buy or sell any type of investment, or as an opinion on, or a suggestion of, the merits of any particular investment strategy.
This letter is not intended to be, nor should it be construed as, a marketing or solicitation vehicle for CPM or its Funds. The information herein does not provide a complete presentation of the investment strategies or portfolio holdings of the Funds and should not be relied upon for purposes of making an investment or divestment decision with respect to the Funds. Those who are considering an investment in the Funds should carefully review the relevant Fund’s offering memorandum and the information concerning CPM, including its SEC Form ADV Brochure which is available at: www.adviserinfo.sec.gov.
This presentation should not be construed as legal, tax, investment, financial or other advice. It does not have regard to the specific investment objective, financial situation, suitability, or the particular need of any specific person who may receive this presentation and should not be taken as advice on the merits of any investment decision. The views expressed in this presentation represent the opinions of CPM and are based on publicly available information with respect to the Issuer. CPM recognizes that there may be confidential information in the possession of the Issuer that could lead the Issuer to disagree with CPM’s conclusions.
CPM currently beneficially owns, and/or has an economic interest in, shares of the Issuers discussed in these letters. Therefore, CPM’s clients, principals and employees may stand to realize significant gains or losses if the price of the companies’ securities move. After the publication or posting of any video, CPM, its principals and employees will continue transacting in the securities discussed, and may be long, short or neutral at any time thereafter regardless of their initial position or recommendation. While certain individuals affiliated with CPM are current or former directors of certain of the Issuers referred to herein, none of the information contained in this presentation or otherwise provided to you is derived from non-public information of such publicly traded companies. CPM has not sought or obtained consent from any third party to use any statements or information indicated herein that have been obtained or derived from statements made or published by such third parties.
The estimates, projections, pro forma information and potential impact of CPM’s analyses set forth herein are based on assumptions that CPM believes to be reasonable as of the date of this presentation, but there can be no assurance or guarantee (i) that any of the proposed actions set forth in this presentation will be completed, (ii) that actual results or performance of the Issuer will not differ, and such differences may be material or (iii) that any of the assumptions provided in this presentation are accurate.
All content posted on CPM’s letters including graphics, logos, articles, and other materials, is the property of CPM or others and is protected by copyright and other laws. All trademarks and logos are the property of their respective owners, who may or may not be affiliated with CPM. Nothing contained on CPM’s website or social media networks should be construed as granting, by implication, estoppel, or otherwise, any license or right to use any content or trademark displayed on any site without the written permission of CPM or such other third party that may own the content or trademark displayed on any site.
Performance
Performance data represents past performance, and past performance does not guarantee future results. Performance data is subject to revision following each monthly reconciliation and/or annual audit. Individual performance may be lower or higher than the performance data presented. The currency used to express performance is U.S. dollars. Before January 1, 2003, the results reflect accounts managed at a predecessor firm.
1 – Net returns reflect the performance of an investor who invested from inception and is eligible to participate in new issues and side pocket investments. Net returns reflect the reinvestment of dividends and earnings and the deduction of all expenses and fees (including the highest management fee and incentive allocation charged, where applicable). An actual client’s results may vary due to the timing of capital transactions, high watermarks, and performance.
2 – Performance figures presented Excluding SCM SP represent the fund’s net returns calculated without the impact of the San Cristobal Mining, Inc. side pocket that was designated on July 1st, 2024. The side pocket includes a private equity asset that is not available to new investors in the funds on or after July 1, 2024. Excluding these assets provides a clearer view of the performance to investors coming into the funds after that date. New investors cannot participate in the SCM Side Pocket and will not share in its potential gains or losses. Investors should consider both the overall performance and the performance excluding the side pocket when evaluating the fund’s returns.
3 – The SMA composites include all accounts that are managed according to CPM’s precious metals or large cap SMA strategy over which it has full discretion. Investment results shown are for taxable and tax-exempt accounts. Any possible tax liabilities incurred by the taxable accounts are not reflected in net performance. Performance results are time weighted and reflect the deduction of advisory fees, brokerage commissions, and other expenses that a client would have paid, and includes the reinvestment of dividends and other earnings. 14
Risks of Investment Securities: Diversity in holdings is an important aspect of risk management, and CPM works to maintain a variety of themes and equity types to capitalize on trends and abate risk. CPM invests in a wide range of securities depending on its strategies, as described above, including but not limited to long equities, short equities, mutual funds, ETFs, commodities, commodity futures contracts, currency futures contracts, fixed income futures contracts, private placements, precious metals, and options on equities, bonds and futures contracts. The investment portfolios advised or sub-advised by CPM are not guaranteed by any agency or program of the U.S. or any foreign government or by any other person or entity. The types of securities CPM buys and sells for clients could lose money over any timeframe. CPM’s investment strategies are intended primarily for long-term investors who hold their investments for substantial periods of time. Prospective clients and investors should consider their investment goals, time horizon, and risk tolerance before investing in CPM’s strategies and should not rely on CPM’s strategies as a complete investment program for all of their investable assets. Of note, in cases where CPM pursues an activist investment strategy by way of control or ownership, there may be additional restrictions on resale including, for example, volume limitations on shares sold. When CPM’s private investment funds or SMA strategies invest in the precious metals mining industry, there are particular risks related to changes in the price of gold, silver and platinum group metals. In addition, changing inflation expectations, currency fluctuations, speculation, and industrial, government and global consumer demand; disruptions in the supply chain; rising product and regulatory compliance costs; adverse effects from government and environmental regulation; world events and economic conditions; market, economic and political risks of the countries where precious metals companies are located or do business; thin capitalization and limited product lines, markets, financial resources or personnel; and the possible illiquidity of certain of the securities; each may adversely affect companies engaged in precious metals mining related businesses. Depending on market conditions, precious metals mining companies may dramatically outperform or underperform more traditional equity investments. In addition, as many of CPM’s positions in the precious metals mining industry are made through offshore private placements in reliance on exemption from SEC registration, there may be U.S. and foreign resale restrictions applicable to such securities, including but not limited to, minimum holding periods, which can result in discounts being applied to the valuation of such securities. In addition, the fair value of CPM’s positions in private placements cannot always be determined using readily observable inputs such as market prices, and therefore may require the use of unobservable inputs which can pose unique valuation risks. Furthermore, CPM’s private investment funds and SMA strategies may invest in stocks of companies with smaller market capitalizations. Small- and medium-capitalization companies may be of a less seasoned nature or have securities that may be traded in the over-the-counter market. These “secondary” securities often involve significantly greater risks than the securities of larger, better-known companies. In addition to being subject to the general market risk that stock prices may decline over short or even extended periods, such companies may not be well-known to the investing public, may not have significant institutional ownership and may have cyclical, static or only moderate growth prospects. Additionally, stocks of such companies may be more volatile in price and have lower trading volumes than larger capitalized companies, which results in greater sensitivity of the market price to individual transactions. CPM has broad discretion to alter any of the SMA or private investment fund’s investment strategies without prior approval by, or notice to, CPM clients or fund investors, provided such changes are not material.
Benchmarks
RUSSELL 1000 GROWTH INDEX. The Russell 1000® Growth Index measures the performance of the large cap growth segment of the US equity universe. It includes those Russell 1000 companies with relatively higher price-to-book ratios, higher I/B/E/S forecast medium term (2 year) growth and higher sales per share historical growth (5 years). The Russell 1000® Growth Index is constructed to provide a comprehensive and unbiased barometer for the large-cap growth segment. The index is completely reconstituted annually to ensure new and growing equities are included and that the represented companies continue to reflect growth characteristics. 15
HFRX GLOBAL HEDGE FUND INDEX. The HFRX Global Hedge Fund Index represents a broad universe of hedge funds with the capability to trade a range of asset classes and investment strategies across the global securities markets. The index is weighted based on the distribution of assets in the global hedge fund industry. It is a tradeable index of actual hedge funds. It is a suitable benchmark for the Crescat Global Macro private fund which has also traded in multiple asset classes and applied a multi-disciplinary investment process since inception.
HFRX EQUITY HEDGE INDEX. The HFRX Equity Hedge Index represents an investable index of hedge funds that trade both long and short in global equity securities. Managers of funds in the index employ a wide variety of investment processes. They may be broadly diversified or narrowly focused on specific sectors and can range broadly in terms of levels of net exposure, leverage employed, holding periods, concentrations of market capitalizations and valuation ranges of typical portfolios. It is a suitable benchmark for the Crescat Long/Short private fund, which has also been predominantly composed of long and short global equities since inception.
PHILADELPHIA STOCK EXCHANGE GOLD AND SILVER INDEX. The Philadelphia Stock Exchange Gold and Silver Index is the longest running index of global precious metals mining stocks. It is a diversified, capitalization-weighted index of the leading companies involved in gold and silver mining. It is a suitable benchmark for the Crescat Precious Metals private fund and the Crescat Precious Metals SMA strategy, which have also been predominately composed of precious metals mining companies involved in gold and silver mining since inception.
S&P 500 INDEX. The S&P 500 Index is perhaps the most followed stock market index. It is considered representative of the U.S. stock market at large. It is a market cap-weighted index of the 500 largest and most liquid companies listed on the NYSE and NASDAQ exchanges. While the companies are U.S. based, most of them have broad global operations. Therefore, the index is representative of the broad global economy. It is a suitable benchmark for the Crescat Global Macro and Crescat Long/Short private funds, and the Large Cap and Precious Metals SMA strategies, which have also traded extensively in large, highly liquid global equities through U.S.-listed securities, and in companies Crescat believes are on track to achieve that status. The S&P 500 Index is also used as a supplemental benchmark for the Crescat Precious Metals private fund and Precious Metals SMA strategy because one of the long-term goals of the precious metals strategy is low correlation to the S&P 500.
MSCI ALL COUNTRY WORLD INDEX (ACWI). The MSCI All Country World Index is a market capitalization-weighted index that offers investors a snapshot of global equity market performance. It is designed to represent the performance of both developed and emerging markets, providing a comprehensive overview of the global investment landscape. To determine the composition of the index, MSCI, the leading provider of equity indexes, considers three categories of stocks: 1) Large-cap stocks from developed markets, 2) Large-cap stocks from emerging markets, 3) Mid-cap and small-cap stocks from both developed and emerging markets. By including stocks from various market segments, the ACWI ensures a balanced representation across different regions and market caps. This helps provide a more accurate reflection of global equity market performance. The ACWI is rebalanced periodically to maintain its integrity and relevance as market conditions change. The index is reviewed on a quarterly basis, ensuring that any changes in market capitalizations or country classifications are appropriately reflected. The index consists of stocks from more than 50 countries worldwide, covering both developed and emerging markets.
Bloomberg Industrial Metals Subindex (BCOMIN) is an index that tracks the performance of futures contracts related to specific industrial metals. These metals include aluminum, copper, nickel, and zinc.
Standard and Poor’s 500 Metals & Mining Index is a capitalization-weighted index. The index was developed with a base level of 10 for the 1941-43 base period. The parent index is SPXL3. This is a GICS Level 3 Industries. Intraday values are calculated by Bloomberg and not supported by S&P DJI, however the close price in HP<GO> is the official close price calculated by S&P DJI.
The Invesco DB Agriculture Fund seeks to track changes, whether positive or negative, in the level of the DBIQ Diversified Agriculture Index Excess Return™ (DBIQ Diversified Agriculture Index ER or Index) plus the interest income from the Fund’s holdings of primarily US Treasury securities and money market income less the Fund’s expenses. The Index is a rules-based index composed of futures contracts on some of the most liquid and widely traded agricultural commodities.
S&P GSCI Equal Weight Commodity Sector is an index that tracks the performance of a broad basket of commodities futures contracts, divides commodities into five main sectors: energy, precious metals, industrial metals, agriculture, and livestock, assigns equal weight to each of these five sectors, regardless of their production volumes or market sizes, aims to provide more balanced exposure across different commodity sectors compared to the production-weighted standard S&P GSCI.
The Consumer Price Index (CPI) is a measure of the average change over time in the prices paid by urban consumers for a market basket of consumer goods and services.
Global Money Supply is the total amount of monetary assets available in the economy at a given time. This index measures the entire stock of currency and other liquid instruments in circulation in an economy at a specific point in time. It includes cash in circulation (physical currency), bank deposits that can be easily converted to cash, other liquid assets, depending on the specific measure used. This index calculates the aggregate money supply across the entire global economy measured by Bloomberg.
References to indices, benchmarks or other measures of relative market performance over a specified period of time are provided for your information only. Reference to an index does not imply that the fund or separately managed account will achieve returns, volatility or other results similar to that index. The composition of an index may not reflect the manner in which a portfolio is constructed in relation to expected or achieved returns, portfolio guidelines, restrictions, sectors, correlations, concentrations, volatility or tracking.
Separately Managed Account (SMA) disclosures: The Crescat Large Cap Composite and Crescat Precious Metals Composite include all accounts that are managed according to those respective strategies over which the manager has full discretion. SMA composite performance results are time-weighted net of all investment management fees and trading costs including commissions and non-recoverable withholding taxes. Investment management fees are described in CPM’s Form ADV 2A. The manager for the Crescat Large Cap strategy invests predominantly in equities of the top 1,000 U.S. listed stocks weighted by market capitalization. The manager for the Crescat Precious Metals strategy invests predominantly in a global all-cap universe of precious metals mining stocks.
Hedge Fund disclosures: Only accredited investors and qualified clients will be admitted as limited partners to a CPM hedge fund. For natural persons, investors must meet SEC requirements including minimum annual income or net worth thresholds. CPM’s hedge funds are being offered in reliance on an exemption from the registration requirements of the Securities Act of 1933 and are not required to comply with specific disclosure requirements that apply to registration under the Securities Act. The SEC has not passed upon the merits of or given its approval to CPM’s hedge funds, the terms of the offering, or the accuracy or completeness of any offering materials. A registration statement has not been filed for any CPM hedge fund with the SEC. Limited partner interests in the CPM hedge funds are subject to legal restrictions on transfer and resale. Investors should not assume they will be able to resell their securities. Investing in securities involves risk. Investors should be able to bear the loss of their investment. Investments in CPM’s hedge funds are not subject to the protections of the Investment Company Act of 1940.
Investors may obtain the most current performance data, private offering memoranda for CPM’s hedge funds, and information on CPM’s SMA strategies, including Form ADV Part 2 and 3, by contacting Linda Smith at (303) 271-9997 or by sending a request via email to lsmith@crescat.net. See the private offering memorandum for each CPM hedge fund for complete information and risk factors.