The Federal Reserve has signaled lower short-term rates ahead, but two important macro questions have yet to be answered:
- Do the asset bubbles of the post Global Financial Crisis zero-interest-rate-policy era still need to be unwound?
- Has the Fed truly conquered US long-term inflation expectations or might Jerome Powell’s victory lap at Jackson Hole have been premature?
Lingering Asset Bubbles
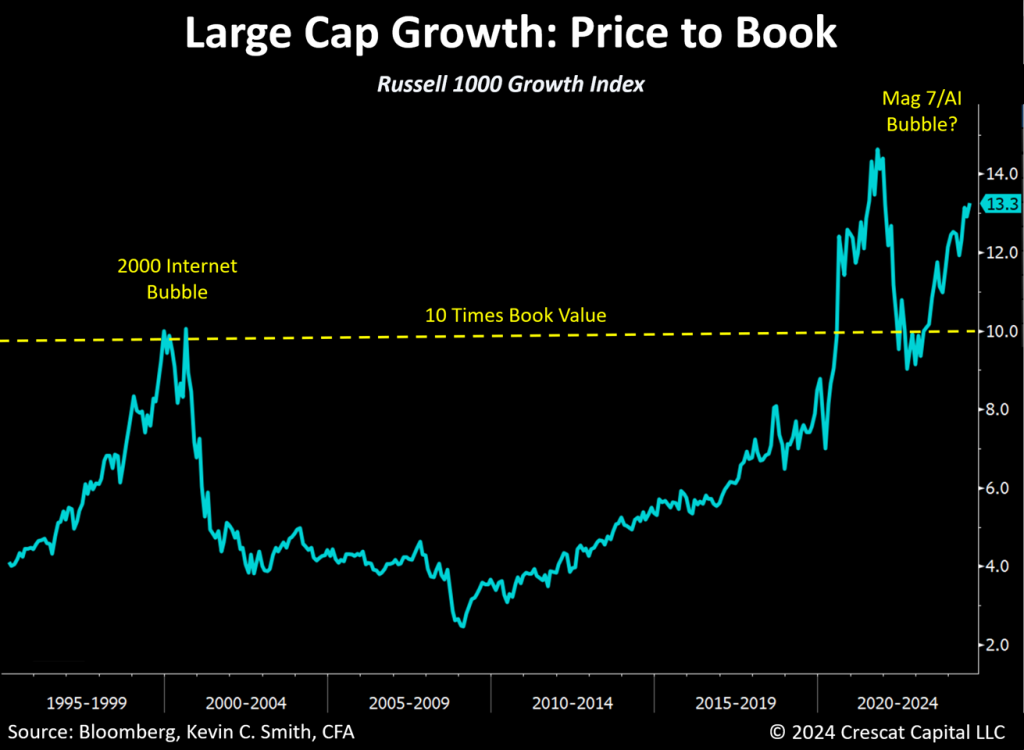
We contend there is no permanent new plateau for large-cap growth equity valuations. In our view, the megacap tech segment of the Russell 1000 Growth Index, fueled by AI euphoria and the Magnificent 7, presents one of the biggest downside risks to financial markets and the economy today. We will build on this thesis throughout this letter.
Disclosure: Crescat may or may not hold positions at any given time in the securities referenced herein. This is not a recommendation or endorsement to buy or sell any security or other financial instrument. The information reflected in the chart above is represented as of 8/23/24.
Nvidia: Leading Vendor to the AI Hyperscalers
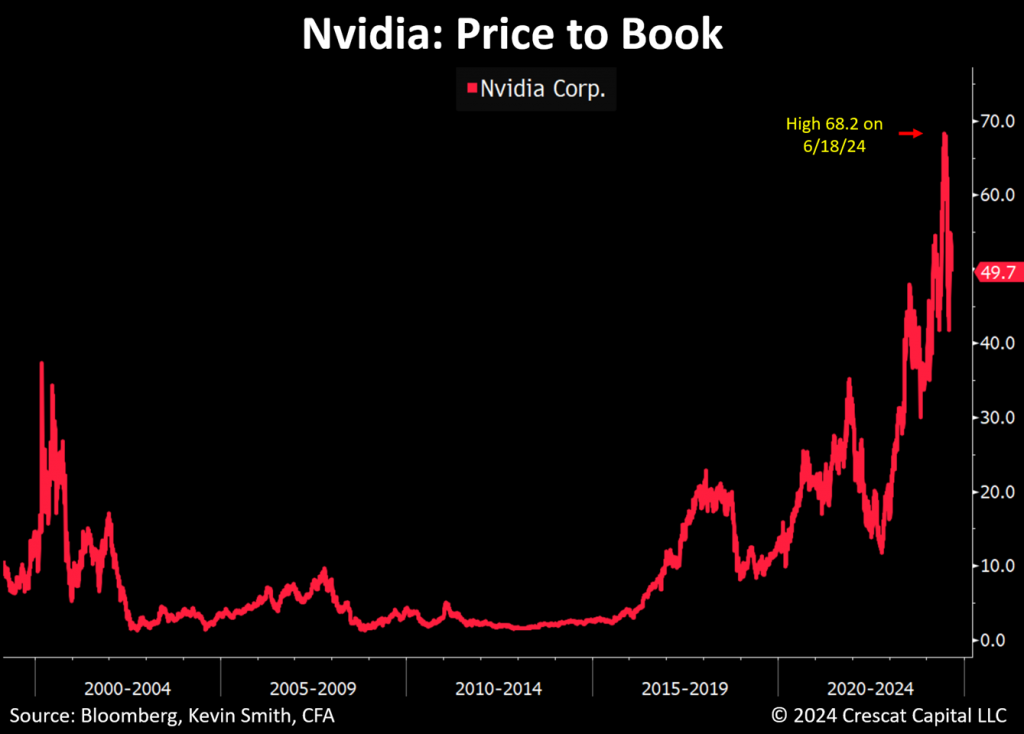
Nvidia has capitalized on its technological lead in graphics processing hardware. Its GPUs have become the dominant brute-force engine for AI training in the cloud. Nvidia’s earnings growth and profit margins have reached historic high levels for the company over the past five quarters, with EPS year-over-year growth peaking to date at 1,089% in the quarter ended 10/29/23 and gross margins topping so far at 78.4% in the quarter ended 4/28/24 which is outstanding for the whole IT sector. But selling high-end computer chips to AI hyperscalers is a double-edged sword. It’s great for Nvidia and its shareholders as long as the capital spending party is still raging, but what happens if Nvidia‘s customers are not getting a positive return on that investment? The party could be over and might even end in an economy-wide hangover. We’ll explore this idea further below.
Some of Nvidia’s customers may already be pulling in the reins as Nvidia’s recent quarter featured growth deceleration, lower gross margins, lower positive earnings and sales surprises, and tempered guidance. Meanwhile, AI software is getting smarter and more efficient in burning less raw GPU power for the same computing tasks. Competition in GPUs from AMD and Intel is also heating up. In this environment, we don’t see how Nvidia can continue to deliver the high growth and margins necessary to justify its historically high valuation with multiples of 52.4 times book value and 30.3 times enterprise value compared to trailing twelve months sales. Perhaps that is why billionaire investor and famed macro trader Stan Druckenmiller sold the vast majority of his formerly hefty Nvidia position over the last two quarters per his family office’s 13F filings.
Disclosure: Crescat may or may not hold positions at any given time in the securities referenced herein. This is not a recommendation or endorsement to buy or sell any security or other financial instrument. The information reflected in the chart above is represented as of 8/29/24.
Apple: Late to the AI Party
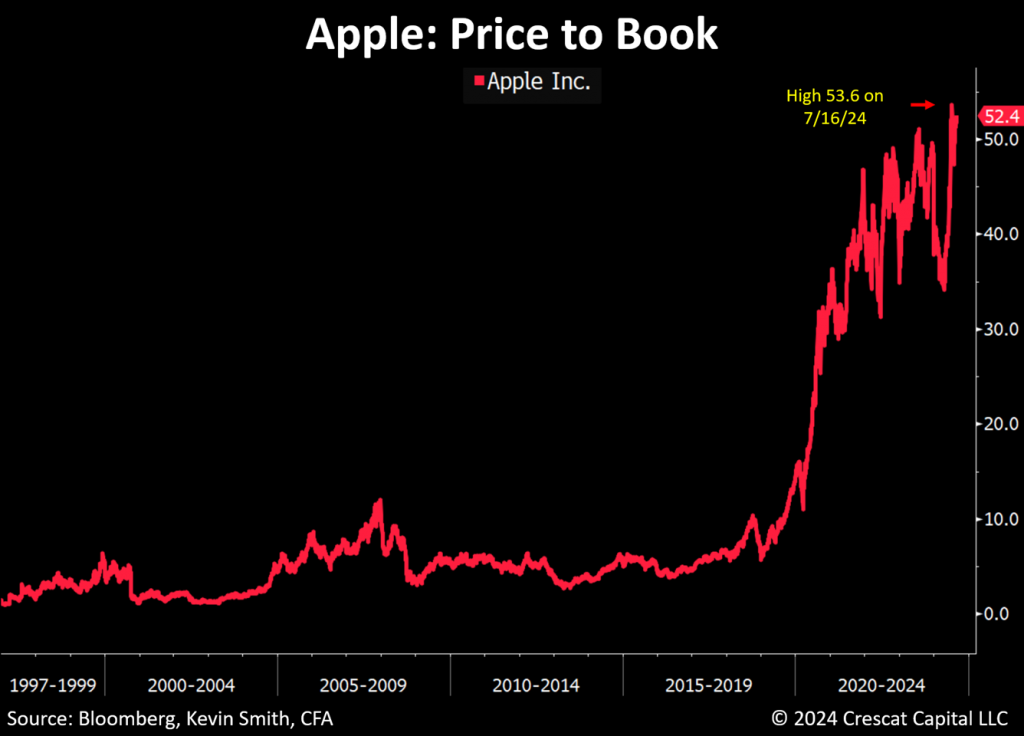
In our analysis, Apple represents another asset bubble in the IT sector at risk of unwinding. Other than the Apple Watch and AirPods, the company has not successfully introduced many new products to the market in recent years. Virtual reality headsets were essentially a flop. The self-driving car was a complete write-off. It seems that organic innovation at Apple has been lacking without the leadership of Steve Jobs. CEO Tim Cook has been adept at extending the company’s dominant smartphone franchise, but growth has stalled. Apple’s sales declined year-over-year in five of the last seven quarters while the company has missed out almost entirely to date on the AI party. Recently, its shares have been buoyed by the hope that adding outsourced AI features to its iPhone handsets will revive growth next quarter. We do not share the same optimism. Neither likely does value investing sage, Warren Buffett, the Oracle of Omaha, the company’s largest shareholder who sold almost half of his firm Berkshire Hathaway’s position per its latest 10-Q.
Disclosure: Crescat may or may not hold positions at any given time in the securities referenced herein. This is not a recommendation or endorsement to buy or sell any security or other financial instrument. The information reflected in the chart above is represented as of 8/29/24.
Capex Cycles Drive Booms and Busts
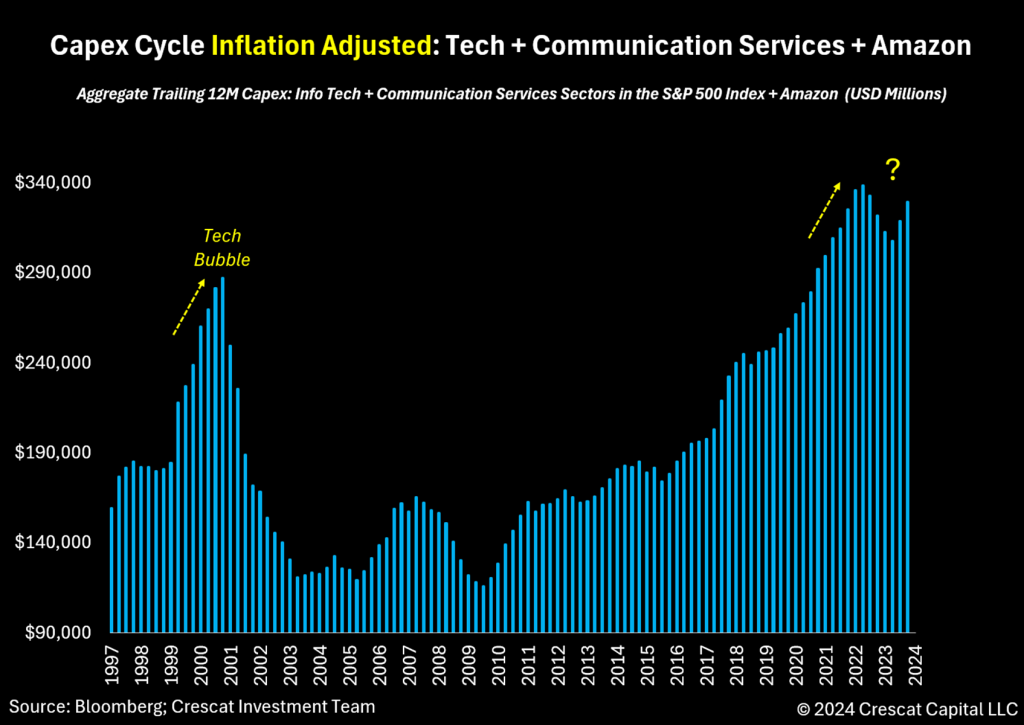
We believe unsustainable capital expenditure trends in the broad technology and communications sectors are an economic warning signal. The chart below shows how the capex cycle drove the boom and bust of the 2000 tech and telecommunications bubble. We inflation-adjusted the data in this chart using the Consumer Price Index to display the entire time series in today’s dollars. It reveals a comparably larger extreme capex binge in real terms in recent years compared to the 2000 Internet spending peak in those same two sectors. We have added Amazon to this group because the company is the largest tech hyperscaler today as we explain further below. It is otherwise overlooked because it is categorized in the consumer discretionary sector due to its online retail business. We are excited about the technological advancements in AI that all this spending has produced, but our research shows that capital spending trends are cyclical. It’s a basic law of economics that companies cannot spend endlessly without a clear path to getting a positive net-present-value return on that investment.
Disclosure: Crescat may or may not hold positions at any given time in the securities referenced herein. This is not a recommendation or endorsement to buy or sell any security or other financial instrument . The information reflected in the chart above is represented through the June quarter of 2024.
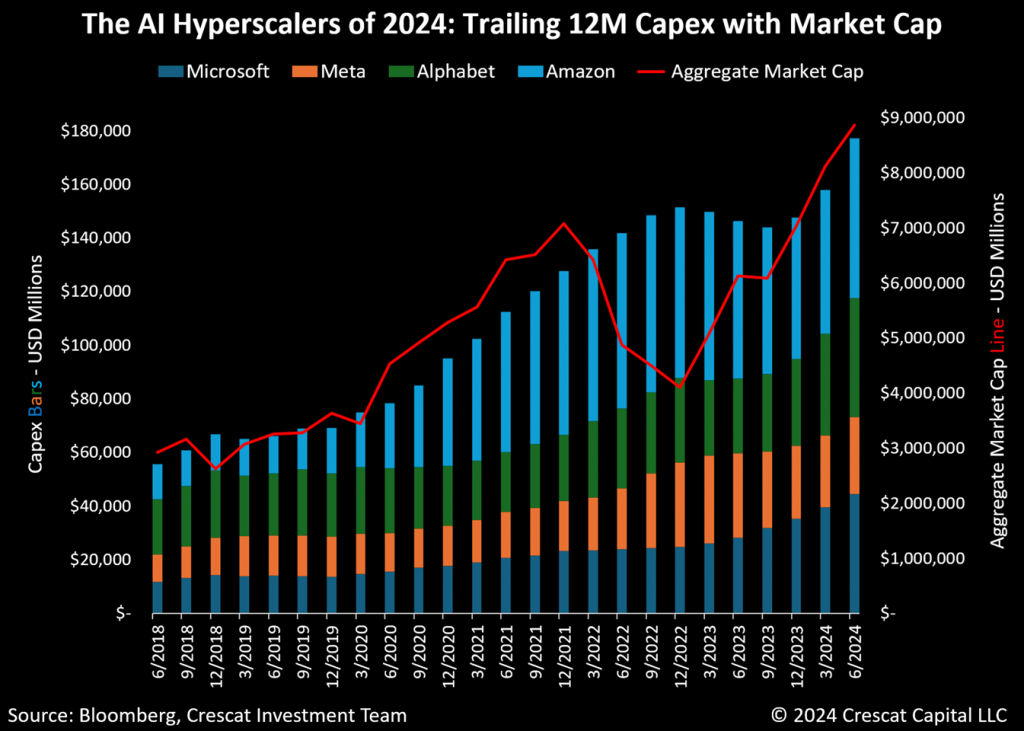
The AI Hyperscalers
The four leading capex spenders today, Amazon, Microsoft, Alphabet, and Meta have been dubbed the hyperscalers for their massive data centers and cloud computing businesses that can scale up and down based on customer demand including demand for AI training and inference services. It is a high-capex, relatively low-profit margin competitive business. In the chart below, we show the capex spending trends and combined market caps of the four hyperscalers.
Amazon’s AWS division is the leading cloud services hyperscaler. Alphabet and Microsoft have been trying to compete directly with AWS in this business, but it is not their high-profit-margin core business. Amazon is a company that thrives on efficiency, scale, and low margins based on the philosophy and competitive drive of its chairman and founder, Jeff Bezos. “Your margin is my opportunity” is his motto. Alphabet and Microsoft meanwhile are accustomed to earning high margins in monopoly-like search advertising and software businesses. We think Microsoft and Alphabet will continue to struggle to compete with Amazon in low-margin hyperscale AI cloud services yet both companies are significantly ramping up investment in that effort. We expect this to drive the return on capital and profit margins down for all three cloud providers.
Meta does not compete in the cloud business but is still considered the fourth largest hyperscaler based on its massive data centers and high capex spend. Meta is building organic AI technology and applying it to its social media and advertising business. The high capital investment required to compete in the AI hyperscale business is extraordinary. The biggest portion of this spending today is going to richly priced, fast-depreciating Nvidia GPUs.
Disclosure: Crescat may or may not hold positions at any given time in the securities referenced herein. This is not a recommendation or endorsement to buy or sell any security or other financial instrument. The information reflected in the chart above is represented through the June quarter of 2024.
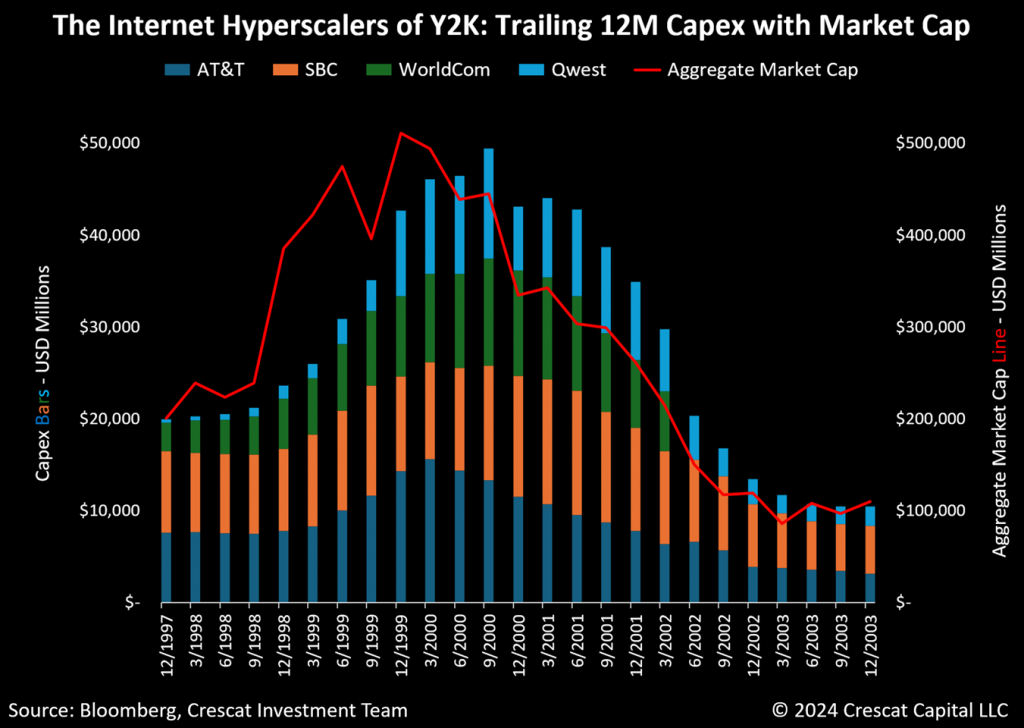
Tech Hyperscaling is Not a New Phenomenon
For comparison to today’s hyperscalers, we want to look at the four leading capex spending companies during the late 1990s Internet boom. Our Bloomberg research confirms those to have been AT&T, SBC Communications, WorldCom, and Qwest. We show these companies’ capital spending and combined market cap trends, at that time, in the chart below. What it shows is that when big companies spend aggressively in a race to build tech infrastructure for an exciting new-era technology without a feasible business plan for getting a return on that investment, we believe it creates a boom and bust for the entire industry, sector, and economy. Could today’s tech hyperscalers be taking us down the same path as these forerunners?
Disclosure: Crescat may or may not hold positions at any given time in the securities referenced herein. This is not a recommendation or endorsement to buy or sell any security or other financial instrument. The information reflected in the chart above is represented through the June quarter of 2024.
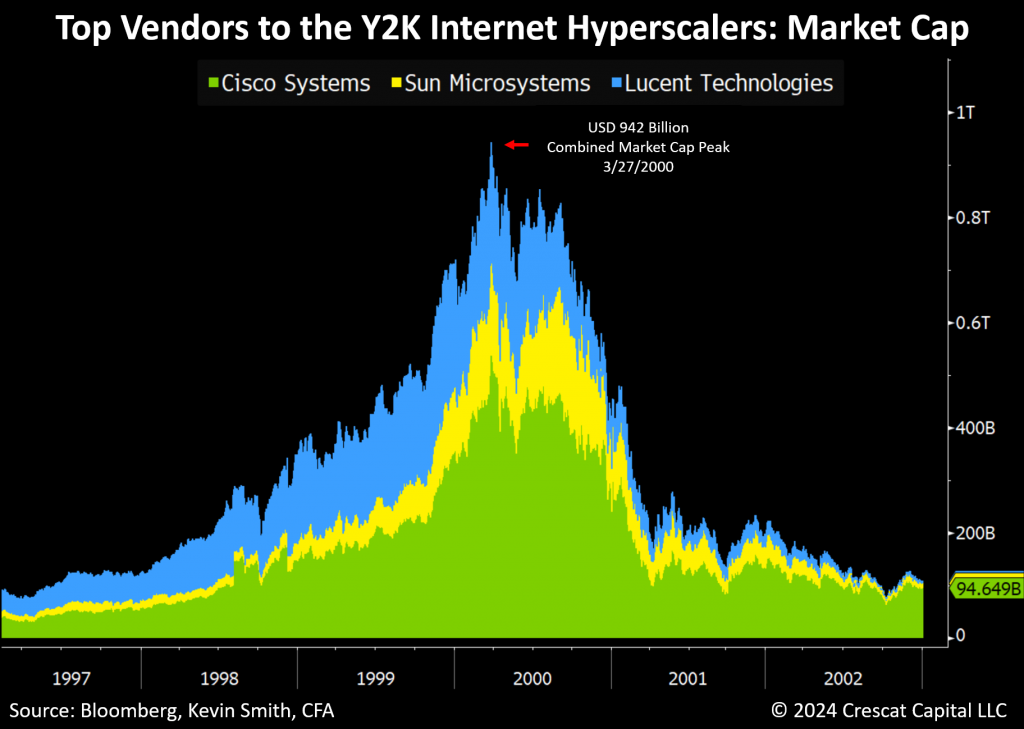
What Happened to the Y2K High-End Equipment Dealers?
Nvidia is the leading vendor to today’s hyperscalers, but who were their Y2K counterparts? Based on our Bloomberg research, Cisco Systems, Sun Microsystems, and Lucent Technologies were three of the top vendors at the time. The stacked chart below shows the combined market cap of these three companies during that period. First, they appreciated more than tenfold in the three years leading up to early 2000 while their customers binged on capital spending. Then, their combined market cap declined by almost 90% as the capex spending trend reversed sharply in the tech bust and recession.
Disclosure: Crescat may or may not hold positions at any given time in the securities referenced herein. This is not a recommendation or endorsement to buy or sell any security or other financial instrument. The data reflected is daily from 1997 through 2002 extracted from the Bloomberg database as of 8/30/24.
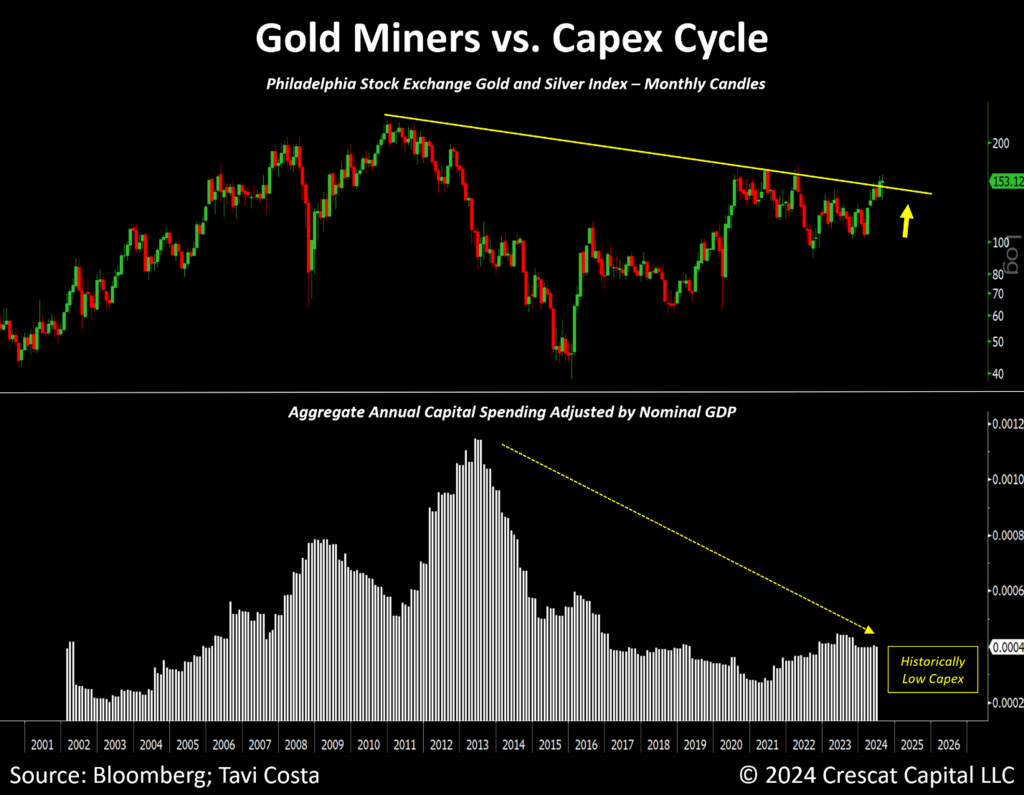
The Capex Cycle for Mining Looks Bullish
While understanding the capex cycle can be helpful for warning when it could be late in the game for a particular sector or industry, it can also be useful for identifying when it might be early.
“Bull markets are born on pessimism, grow on skepticism, mature on optimism, and die on euphoria.” – John Templeton
This quote may capture the current opportunity in the mining industry, which, despite near-record gold prices, remains one of the most under-owned industries in the market today.
Gold, silver, copper, and zinc miners have suffered a prolonged period of investor disinterest combined with social and government permitting headwinds. Such forces have compelled these companies to exercise austere spending measures including drastically reduced capex. Poetic justice for mining companies may yet be served because, in our analysis, the world no longer possesses the metal reserves necessary to supply its growing demand for electricity due to the climate-change-driven energy transition and artificial intelligence.
The world needs metals for electric vehicles, solar, wind, and AI data centers. Silver and copper are critical raw materials for solar panels and the electricity grid. We need zinc for windmills. Meanwhile, gold is a key ingredient in high-end electronics, such as Nvidia GPUs and next-generation quantum computers. The latter only solidifies our view that the yellow metal will remain in favor among global sovereign central banks and citizens alike, as it has for millennia, as the leading global hard-money reserve currency.
With metal prices rising because of these supply and demand imbalances, and due to ongoing global concern about inflation, we think investors will finally become attracted to the mining industry again. As a result, mining companies should start receiving the capital they need to invest in exploration and capex to build new mines. The problem is that it takes an average of 15 years to discover, permit, and build a new mine, so there is potentially a long cycle of rising commodity prices ahead as demand exceeds supply.
In the lower panel of the chart below, we show that it is still likely very early in the capex cycle for the mining industry. It last peaked in 2012 and then went through an 8-year contraction. In the upper panel, we can see that investors have been buying mining stocks as represented by the recent 13-year breakout in the Philadelphia Stock Exchange Gold and Silver Index. We believe that mining stocks have a long runway ahead as capital will likely continue to flow back into the industry under rising commodity prices. Note that the last secular increasing capex cycle lasted about 10 years while we are only about 3 years into the current one. Furthermore, the chart shows that we are far away from prior peak levels of capex spending as a ratio of GDP that would likely need to be reached again before warning of a top.
Disclosure: Crescat may or may not hold positions at any given time in the securities referenced herein. This is not a recommendation or endorsement to buy or sell any security or other financial instrument. The information reflected in the chart above is represented through the June quarter of 2024.
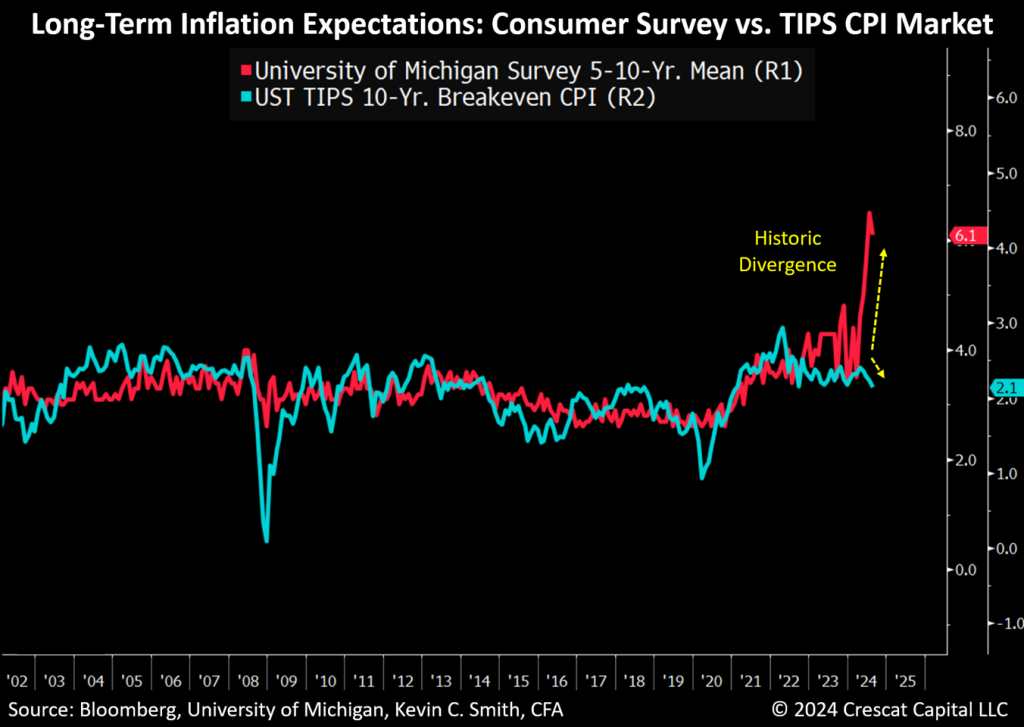
Historic Divergence in Long-Term Inflation Expectations
According to the recent University of Michigan Consumer Survey data, the average US consumer believes that inflation will be 6.1% over the next five to ten years. The Treasury Inflation Protected Securities (TIPS) market on the other hand indicates that CPI will be only 2.1% during that time as we show in the chart below. This suggests consumers believe government CPI statistics will understate actual inflation in the future to a greater degree than ever before. Such a sentiment is understandable. We think the recent historic divergence between these two time series is a measure of current high government mistrust. So, if the Fed is claiming victory over long-term inflation expectations based on the TIPS market alone, we believe it has a lot more work to do. Furthermore, since the Fed has just signaled a green light for interest rate cuts, we expect consumers to remain skeptical that the Fed truly has inflation under control.
Disclosure: Crescat may or may not hold positions at any given time in the securities referenced herein. This is not a recommendation or endorsement to buy or sell any security or other financial instrument. The information reflected in the chart above is represented as of 8/30/24.
Commodity Equity Bull Markets Can Begin with Tech Busts
The chart below from Bank of America shows how an equity bull market in energy, materials, and financials began simultaneously with the 2000 tech and telecom bust using the sectors in the MSCI All-Country World Index. We think a similar rotation in favor of commodity equities is poised to unfold again today based on similar imbalances, positioning, and relative valuations to 2000. The Great Rotation, one of Crescat’s overriding investment themes, which encompasses this transition out of overvalued large cap growth and into undervalued energy and natural resource equities, started to play out through all of 2022. However, here we are again with a complete retest of the extremes. We believe the Great Rotation is still to come.
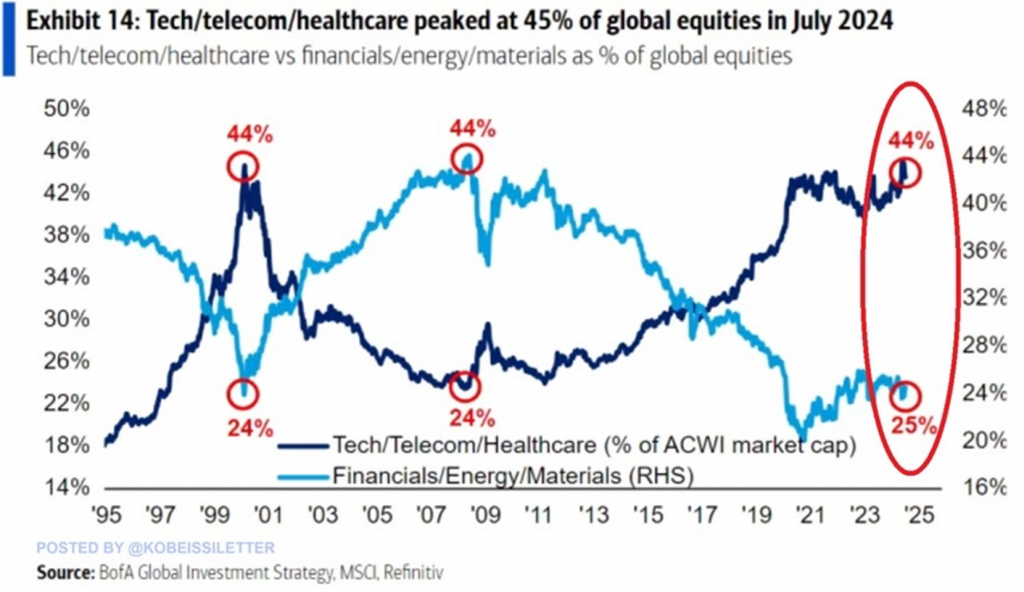
Disclosure: Crescat may or may not hold positions at any given time in the securities referenced herein. This is not a recommendation or endorsement to buy or sell any security or other financial instrument. AWCI refers to the MSCI All-Country Global Index. RHS refers to the right Y axis, i.e., “right-hand side”.
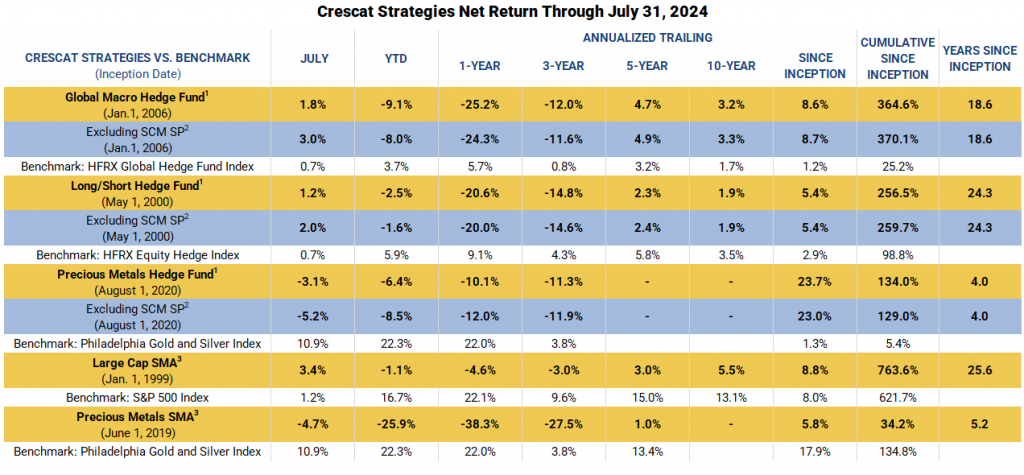
Performance
Net returns are shown below through July in a new format. Performance figures presented “Excluding SCM SP” represent the fund’s net returns calculated without the impact of the San Cristobal Mining, Inc. (“SCM”) side pocket that was designated on July 1st, 2024. The side pocket includes a private equity asset that is not available to new investors in the funds on or after July 1, 2024. Excluding these assets provides a clearer view of the performance to investors coming into the funds after that date. New investors cannot participate in the SCM Side Pocket and will not share in its potential gains or losses. Investors should consider both the overall performance and the performance excluding the side pocket when evaluating the fund’s returns.
Performance data represents past performance, and past performance does not guarantee future results. Performance data is subject to revision following each monthly reconciliation and/or annual audit. Individual performance may be lower or higher than the performance data presented. The currency used to express performance is U.S. dollars. Before January 1, 2003, the results reflect accounts managed at a predecessor firm. See additional performance disclosures below.
We encourage you to reach out to any of us listed below if you would like to learn more about how our vehicles might fit with your individual needs and objectives.
Sincerely,
Kevin C. Smith, CFA
Founding Member & Chief Investment Officer
Tavi Costa
Member & Macro Strategist
Quinton T. Hennigh, PhD
Member & Geologic and Technical Director
For more information including how to invest, please contact:
Marek Iwahashi
Head of Investor Relations
(720) 323-2995
Linda Carleu Smith, CPA
Co-Founding Member & Chief Operating Officer
(303) 228-7371
© 2024 Crescat Capital LLC
Important Disclosures
The purpose of this letter is to provide access to analyses prepared by Crescat Portfolio Management LLC (“CPM”) with respect to certain companies (“Issuers”) in which CPM and certain of the Funds and accounts it manages are shareholders. The letters enable CPM to share macro themes and newsworthy geologic updates, good and bad, across our Issuers as they arise. The letters represent the opinions of CPM, as an exploration industry advocate, on the overall geologic progress of our activist strategy in creating new economic metal deposits in viable mining jurisdictions around the world. Each Issuer discussed has been selected solely for this purpose and has not been selected on the basis of performance or any performance-related criteria. The securities discussed herein do not represent an entire portfolio and in the aggregate may only represent a small percentage of a strategies holdings. The Issuers discussed may or may not be held in such portfolios at any given time. The Issuers discussed do not represent all of the investments purchased or sold by Funds managed by CPM. It should not be assumed that any or all of these investments were or will be profitable.
Projected results and statements contained in this letter that are not historical facts are based on current expectations and involve risks, uncertainties and other factors that may cause actual results, performance or achievements to be materially different from any future results. While investing in the mining industry is inherently risky, CPM believes that under a professionally managed portfolio approach with the guidance of Quinton Hennigh, PhD, CPM’s full-time Geologic and Technical Director, and our proprietary exploration and mining model, we will be able to generate long-term capital appreciation.
These opinions are current opinions as of the date appearing in the relevant material and are subject to change without notice. The information contained in the letters is based on publicly available information with respect to the Issuers as of the date of such white papers and has not been updated since such date.
This letter is not intended to be, nor should it be construed as, an offer to sell or a solicitation of an offer to buy any security. The information provided in this letter is not intended as investment advice or recommendation to buy or sell any type of investment, or as an opinion on, or a suggestion of, the merits of any particular investment strategy.
This letter is not intended to be, nor should it be construed as, a marketing or solicitation vehicle for CPM or its Funds. The information herein does not provide a complete presentation of the investment strategies or portfolio holdings of the Funds and should not be relied upon for purposes of making an investment or divestment decision with respect to the Funds. Those who are considering an investment in the Funds should carefully review the relevant Fund’s offering memorandum and the information concerning CPM, including its SEC Form ADV Brochure which is available at: www.adviserinfo.sec.gov.
This presentation should not be construed as legal, tax, investment, financial or other advice. It does not have regard to the specific investment objective, financial situation, suitability, or the particular need of any specific person who may receive this presentation and should not be taken as advice on the merits of any investment decision. The views expressed in this presentation represent the opinions of CPM and are based on publicly available information with respect to the Issuer. CPM recognizes that there may be confidential information in the possession of the Issuer that could lead the Issuer to disagree with CPM’s conclusions.
CPM currently beneficially owns, and/or has an economic interest in, shares of the Issuers discussed in these letters. Therefore, CPM’s clients, principals and employees may stand to realize significant gains or losses if the price of the companies’ securities move. After the publication or posting of any video, CPM, its principals and employees will continue transacting in the securities discussed, and may be long, short or neutral at any time thereafter regardless of their initial position or recommendation. While certain individuals affiliated with CPM are current or former directors of certain of the Issuers referred to herein, none of the information contained in this presentation or otherwise provided to you is derived from non-public information of such publicly traded companies. CPM has not sought or obtained consent from any third party to use any statements or information indicated herein that have been obtained or derived from statements made or published by such third parties.
The estimates, projections, pro forma information and potential impact of CPM’s analyses set forth herein are based on assumptions that CPM believes to be reasonable as of the date of this presentation, but there can be no assurance or guarantee (i) that any of the proposed actions set forth in this presentation will be completed, (ii) that actual results or performance of the Issuer will not differ, and such differences may be material or (iii) that any of the assumptions provided in this presentation are accurate.
All content posted on CPM’s letters including graphics, logos, articles, and other materials, is the property of CPM or others and is protected by copyright and other laws. All trademarks and logos are the property of their respective owners, who may or may not be affiliated with CPM. Nothing contained on CPM’s website or social media networks should be construed as granting, by implication, estoppel, or otherwise, any license or right to use any content or trademark displayed on any site without the written permission of CPM or such other third party that may own the content or trademark displayed on any site.
Performance
Performance data represents past performance, and past performance does not guarantee future results. Performance data is subject to revision following each monthly reconciliation and/or annual audit. Individual performance may be lower or higher than the performance data presented. The currency used to express performance is U.S. dollars. Before January 1, 2003, the results reflect accounts managed at a predecessor firm.
1 – Net returns reflect the performance of an investor who invested from inception and is eligible to participate in new issues and side pocket investments. Net returns reflect the reinvestment of dividends and earnings and the deduction of all expenses and fees (including the highest management fee and incentive allocation charged, where applicable). An actual client’s results may vary due to the timing of capital transactions, high watermarks, and performance.
2 – Performance figures presented Excluding SCM SP represent the fund’s net returns calculated without the impact of the San Cristobal Mining, Inc. side pocket that was designated on July 1st, 2024. The side pocket includes a private equity asset that is not available to new investors in the funds on or after July 1, 2024. Excluding these assets provides a clearer view of the performance to investors coming into the funds after that date. New investors cannot participate in the SCM Side Pocket and will not share in its potential gains or losses. Investors should consider both the overall performance and the performance excluding the side pocket when evaluating the fund’s returns.
3 – The SMA composites include all accounts that are managed according to CPM’s precious metals or large cap SMA strategy over which it has full discretion. Investment results shown are for taxable and tax-exempt accounts. Any possible tax liabilities incurred by the taxable accounts are not reflected in net performance. Performance results are time weighted and reflect the deduction of advisory fees, brokerage commissions, and other expenses that a client would have paid, and includes the reinvestment of dividends and other earnings.
Risks of Investment Securities: Diversity in holdings is an important aspect of risk management, and CPM works to maintain a variety of themes and equity types to capitalize on trends and abate risk. CPM invests in a wide range of securities depending on its strategies, as described above, including but not limited to long equities, short equities, mutual funds, ETFs, commodities, commodity futures contracts, currency futures contracts, fixed income futures contracts, private placements, precious metals, and options on equities, bonds and futures contracts. The investment portfolios advised or sub-advised by CPM are not guaranteed by any agency or program of the U.S. or any foreign government or by any other person or entity. The types of securities CPM buys and sells for clients could lose money over any timeframe. CPM’s investment strategies are intended primarily for long-term investors who hold their investments for substantial periods of time. Prospective clients and investors should consider their investment goals, time horizon, and risk tolerance before investing in CPM’s strategies and should not rely on CPM’s strategies as a complete investment program for all of their investable assets. Of note, in cases where CPM pursues an activist investment strategy by way of control or ownership, there may be additional restrictions on resale including, for example, volume limitations on shares sold. When CPM’s private investment funds or SMA strategies invest in the precious metals mining industry, there are particular risks related to changes in the price of gold, silver and platinum group metals. In addition, changing inflation expectations, currency fluctuations, speculation, and industrial, government and global consumer demand; disruptions in the supply chain; rising product and regulatory compliance costs; adverse effects from government and environmental regulation; world events and economic conditions; market, economic and political risks of the countries where precious metals companies are located or do business; thin capitalization and limited product lines, markets, financial resources or personnel; and the possible illiquidity of certain of the securities; each may adversely affect companies engaged in precious metals mining related businesses. Depending on market conditions, precious metals mining companies may dramatically outperform or underperform more traditional equity investments. In addition, as many of CPM’s positions in the precious metals mining industry are made through offshore private placements in reliance on exemption from SEC registration, there may be U.S. and foreign resale restrictions applicable to such securities, including but not limited to, minimum holding periods, which can result in discounts being applied to the valuation of such securities. In addition, the fair value of CPM’s positions in private placements cannot always be determined using readily observable inputs such as market prices, and therefore may require the use of unobservable inputs which can pose unique valuation risks. Furthermore, CPM’s private investment funds and SMA strategies may invest in stocks of companies with smaller market capitalizations. Small- and medium-capitalization companies may be of a less seasoned nature or have securities that may be traded in the over-the-counter market. These “secondary” securities often involve significantly greater risks than the securities of larger, better-known companies. In addition to being subject to the general market risk that stock prices may decline over short or even extended periods, such companies may not be well-known to the investing public, may not have significant institutional ownership and may have cyclical, static or only moderate growth prospects. Additionally, stocks of such companies may be more volatile in price and have lower trading volumes than larger capitalized companies, which results in greater sensitivity of the market price to individual transactions. CPM has broad discretion to alter any of the SMA or private investment fund’s investment strategies without prior approval by, or notice to, CPM clients or fund investors, provided such changes are not material.
Benchmarks
RUSSELL 1000 GROWTH INDEX. The Russell 1000® Growth Index measures the performance of the large cap growth segment of the US equity universe. It includes those Russell 1000 companies with relatively higher price-to-book ratios, higher I/B/E/S forecast medium term (2 year) growth and higher sales per share historical growth (5 years). The Russell 1000® Growth Index is constructed to provide a comprehensive and unbiased barometer for the large-cap growth segment. The index is completely reconstituted annually to ensure new and growing equities are included and that the represented companies continue to reflect growth characteristics.
HFRX GLOBAL HEDGE FUND INDEX. The HFRX Global Hedge Fund Index represents a broad universe of hedge funds with the capability to trade a range of asset classes and investment strategies across the global securities markets. The index is weighted based on the distribution of assets in the global hedge fund industry. It is a tradeable index of actual hedge funds. It is a suitable benchmark for the Crescat Global Macro private fund which has also traded in multiple asset classes and applied a multi-disciplinary investment process since inception.
HFRX EQUITY HEDGE INDEX. The HFRX Equity Hedge Index represents an investable index of hedge funds that trade both long and short in global equity securities. Managers of funds in the index employ a wide variety of investment processes. They may be broadly diversified or narrowly focused on specific sectors and can range broadly in terms of levels of net exposure, leverage employed, holding periods, concentrations of market capitalizations and valuation ranges of typical portfolios. It is a suitable benchmark for the Crescat Long/Short private fund, which has also been predominantly composed of long and short global equities since inception.
PHILADELPHIA STOCK EXCHANGE GOLD AND SILVER INDEX. The Philadelphia Stock Exchange Gold and Silver Index is the longest running index of global precious metals mining stocks. It is a diversified, capitalization-weighted index of the leading companies involved in gold and silver mining. It is a suitable benchmark for the Crescat Precious Metals private fund and the Crescat Precious Metals SMA strategy, which have also been predominately composed of precious metals mining companies involved in gold and silver mining since inception.
S&P 500 INDEX. The S&P 500 Index is perhaps the most followed stock market index. It is considered representative of the U.S. stock market at large. It is a market cap-weighted index of the 500 largest and most liquid companies listed on the NYSE and NASDAQ exchanges. While the companies are U.S. based, most of them have broad global operations. Therefore, the index is representative of the broad global economy. It is a suitable benchmark for the Crescat Global Macro and Crescat Long/Short private funds, and the Large Cap and Precious Metals SMA strategies, which have also traded extensively in large, highly liquid global equities through U.S.-listed securities, and in companies Crescat believes are on track to achieve that status. The S&P 500 Index is also used as a supplemental benchmark for the Crescat Precious Metals private fund and Precious Metals SMA strategy because one of the long-term goals of the precious metals strategy is low correlation to the S&P 500.
MSCI ALL COUNTRY WORLD INDEX (ACWI). The MSCI All Country World Index is a market capitalization-weighted index that offers investors a snapshot of global equity market performance. It is designed to represent the performance of both developed and emerging markets, providing a comprehensive overview of the global investment landscape. To determine the composition of the index, MSCI, the leading provider of equity indexes, considers three categories of stocks: 1) Large-cap stocks from developed markets, 2) Large-cap stocks from emerging markets, 3) Mid-cap and small-cap stocks from both developed and emerging markets. By including stocks from various market segments, the ACWI ensures a balanced representation across different regions and market caps. This helps provide a more accurate reflection of global equity market performance. The ACWI is rebalanced periodically to maintain its integrity and relevance as market conditions change. The index is reviewed on a quarterly basis, ensuring that any changes in market capitalizations or country classifications are appropriately reflected. The index consists of stocks from more than 50 countries worldwide, covering both developed and emerging markets.
References to indices, benchmarks or other measures of relative market performance over a specified period of time are provided for your information only. Reference to an index does not imply that the fund or separately managed account will achieve returns, volatility or other results similar to that index. The composition of an index may not reflect the manner in which a portfolio is constructed in relation to expected or achieved returns, portfolio guidelines, restrictions, sectors, correlations, concentrations, volatility or tracking.
Separately Managed Account (SMA) disclosures: The Crescat Large Cap Composite and Crescat Precious Metals Composite include all accounts that are managed according to those respective strategies over which the manager has full discretion. SMA composite performance results are time-weighted net of all investment management fees and trading costs including commissions and non-recoverable withholding taxes. Investment management fees are described in CPM’s Form ADV 2A. The manager for the Crescat Large Cap strategy invests predominantly in equities of the top 1,000 U.S. listed stocks weighted by market capitalization. The manager for the Crescat Precious Metals strategy invests predominantly in a global all-cap universe of precious metals mining stocks.
Hedge Fund disclosures: Only accredited investors and qualified clients will be admitted as limited partners to a CPM hedge fund. For natural persons, investors must meet SEC requirements including minimum annual income or net worth thresholds. CPM’s hedge funds are being offered in reliance on an exemption from the registration requirements of the Securities Act of 1933 and are not required to comply with specific disclosure requirements that apply to registration under the Securities Act. The SEC has not passed upon the merits of or given its approval to CPM’s hedge funds, the terms of the offering, or the accuracy or completeness of any offering materials. A registration statement has not been filed for any CPM hedge fund with the SEC. Limited partner interests in the CPM hedge funds are subject to legal restrictions on transfer and resale. Investors should not assume they will be able to resell their securities. Investing in securities involves risk. Investors should be able to bear the loss of their investment. Investments in CPM’s hedge funds are not subject to the protections of the Investment Company Act of 1940.
Investors may obtain the most current performance data, private offering memoranda for CPM’s hedge funds, and information on CPM’s SMA strategies, including Form ADV Part 2 and 3, by contacting Linda Smith at (303) 271-9997 or by sending a request via email to lsmith@crescat.net. See the private offering memorandum for each CPM hedge fund for complete information and risk factors.