The purpose of this research letter is to illustrate the historic countercyclicality of gold mining stocks versus the broad US stock market over a variety of economic environments. We also highlight divergent valuation opportunities and risks among these two security classes today.
The following five charts consider the performance of gold mining stocks compared to major US stock market indices and include periods during and surrounding the four largest bear markets for US stocks over the last 100 years: 1929-1932, 1973-1974, 2000-2002, and 2008-2009.
The Great Depression
In the deflationary Great Depression, Homestake Mining (HM) was the largest gold mining company in the US and dramatically outperformed the Dow Jones Industrial Average (DJIA). From the DJIA’s high on 9/3/1929 to its low on 7/8/1932, it lost 89% of its value, yet HM’s stock price was up 49%. By 2/20/1936, HM shares had gained 580% while the DJIA was still down 59% from its top.
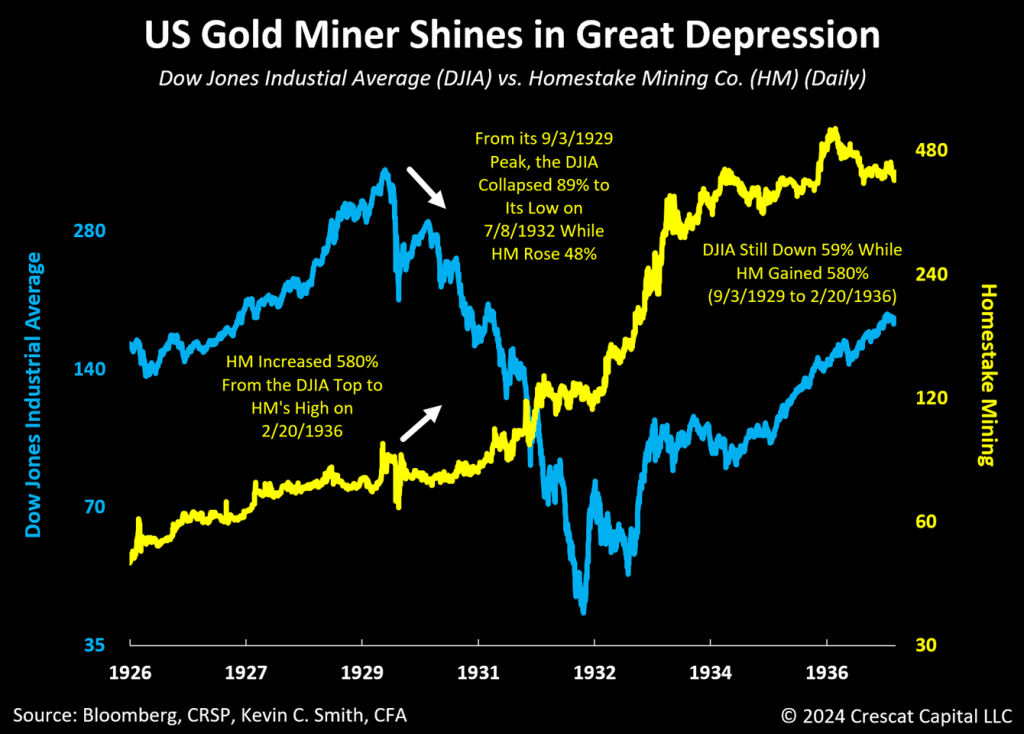
Understanding the potential value of a large new gold discovery at a microcap price, George Hearst (father of William Randolph Hearst) and two partners bought the 10-acre Homestake Mine in South Dakota for $70,000 and incorporated the Homestake Mining Company on 11/5/1877. Homestake Mining Company (HM) became a public company on 1/25/1879, the first mining stock listed on the New York Stock Exchange. The Homestake Mine was the largest producing gold mine in the Western Hemisphere when it was operating. It produced over 40 million troy ounces of gold and continuously operated for 126 years. HM was acquired by Barrick Gold in 2001. The performance information in the chart above excludes dividends for both series.
The Stagflationary 1973-1974 Bear Market
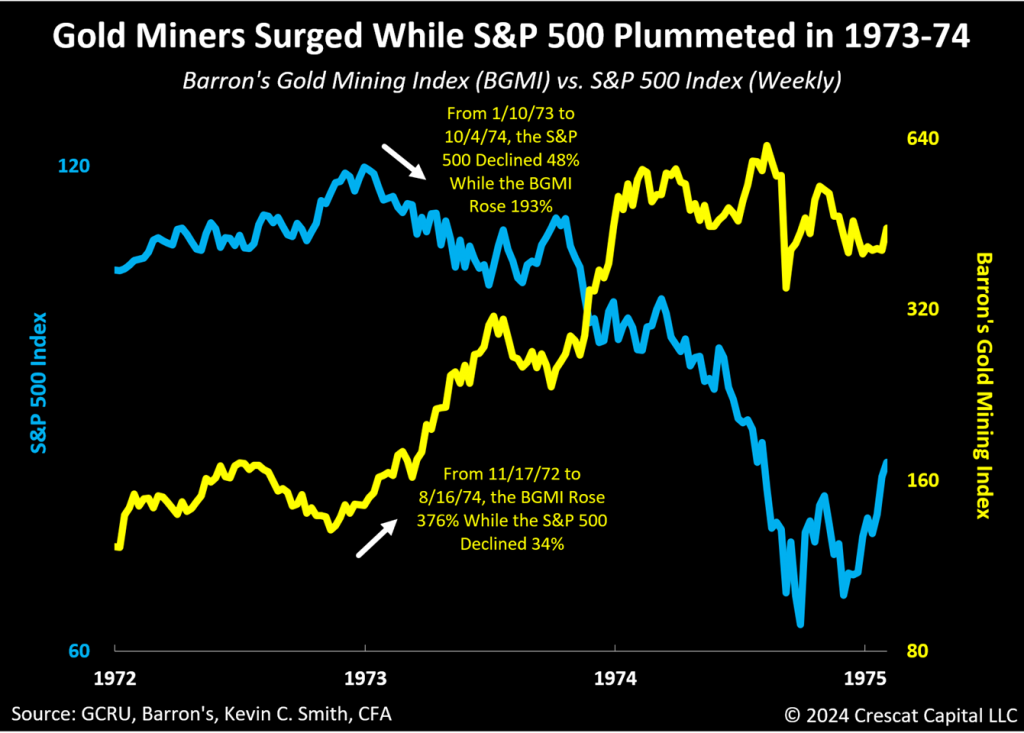
During the stagflationary stock market slide of 1973 and 1974, using weekly data, the S&P 500 fell 48% from its high on 1/10/73 to its low on 10/3/74, a period over which the Barron’s Gold Mining Index (BGMI) rose 193%. The BGMI began rising almost two months before the S&P 500 Index top and continued rising during the S&P 500 bear market. From its lows on 11/17/1972 to its intermediate high on 8/16/1974, the BGMI was up 376%, a period over which the S&P 500 was down 34%.
The Entire 1970 Decade and More
Over the 11-year secular bull market for gold miners from 12/26/1969 to 10/17/1980, the Barron’s Gold Mining Index increased 1,247% while the S&P 500 was up only 43% over the same period.
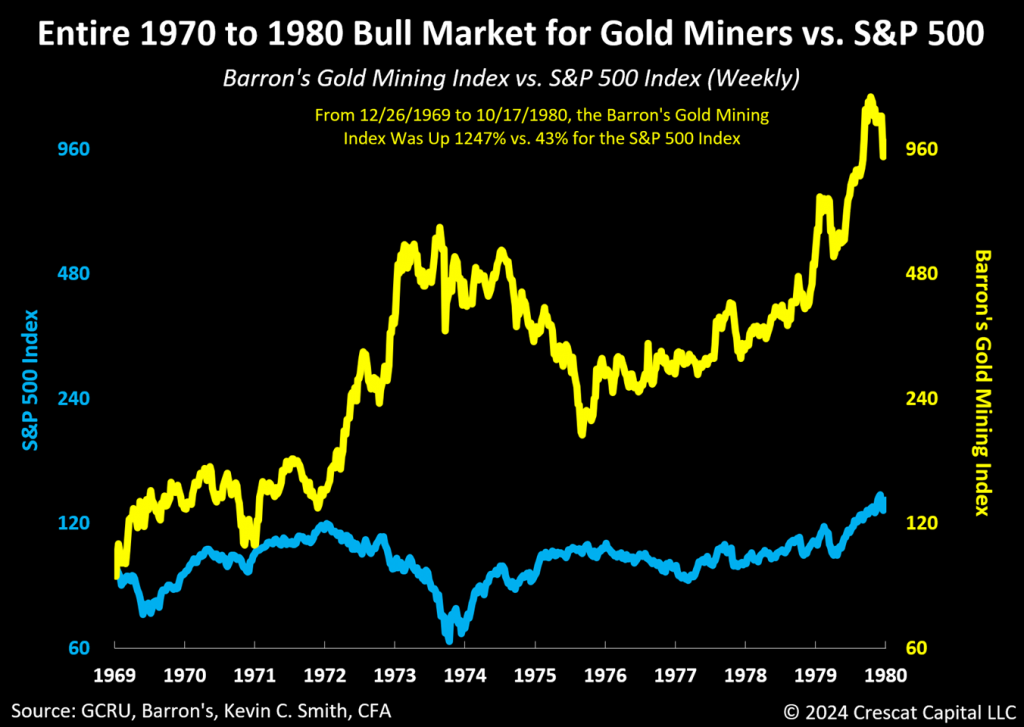
Barron’s Gold Mining Index (BGMI) is a price-weighted industry average of publicly traded gold mining stocks. Barron’s weekly financial news service started publishing the average in 1938. When Barron’s discontinued its industry stock average series in October 1988, it repackaged its gold mining average as the BGMI. The BGMI is a suitable gold mining index for historic market analysis purposes because it has a long history of weekly data from a reputable financial news source and therefore is a reliable index for US publicly listed mining stocks that existed before the launch of the Philadelphia Gold and Silver Stock Index (XAU Index) in 1979. The performance information in the chart above excludes dividends for both series.
The 2000-2002 Telecom, Tech, and Internet Bust
The early innings of the 2000 tech bust marked the end of a long bear market for precious metals mining stocks since the BGMI’s high on 10/17/1980 after which point it fell 82% through 11/3/2000 while the S&P 500 was up 985% over the same time frame. The worst of that bear market for mining stocks happened from 1996 to 2000 when technology stocks were booming before topping in 2000, potentially not unlike today as we explain further below. Starting on 11/3/2000, a new secular bull market for mining stocks began while tech stocks plunged.
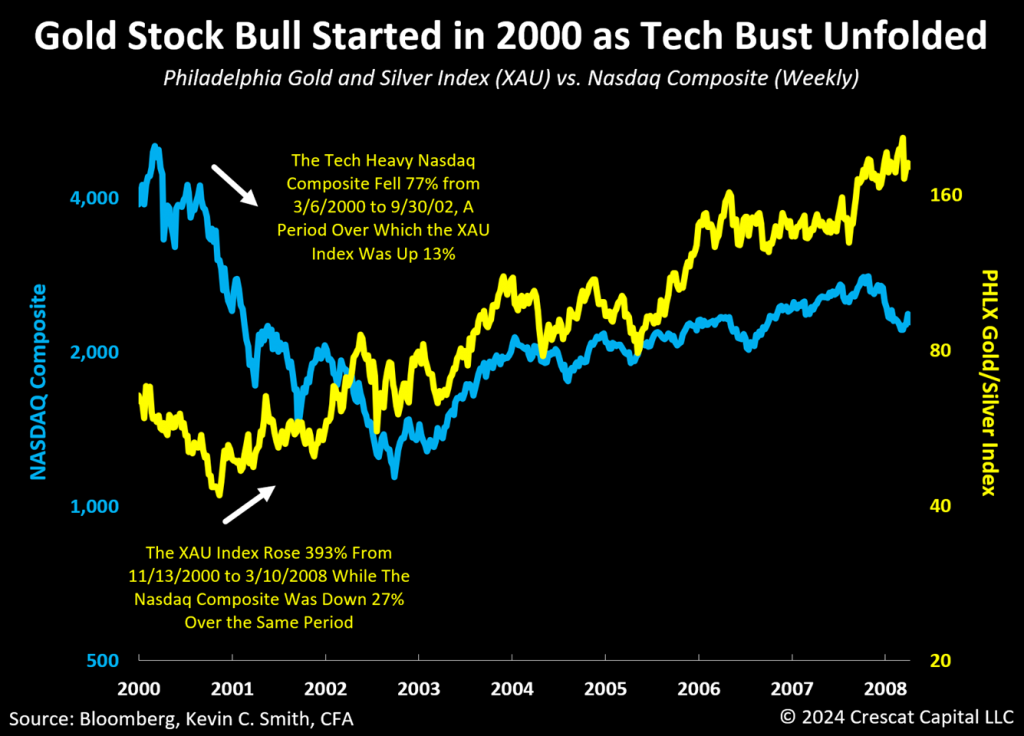
The Nasdaq Composite was a popular broad market index in the 1990s and early 2000s Internet era because it included an abundance of technology stocks. The Philadelphia Gold and Silver Stock Index (XAU Index) was launched in 1979. It is a capitalization-weighted index of global large and mid-cap gold and silver mining companies that trade on a US exchange. The XAU Index has become the predominant benchmark for gold and silver mining stocks since its inception. Its composition is reviewed quarterly for potential updates. The performance information in the chart above excludes dividends for both series.
Countercyclical Setup in Deeply Undervalued Precious Metal Explorers
The S&P/TSX Venture Composite Index (“TSX-V Index”) is a proxy for precious metal explorers as we explain below. Based on historical analysis the TSX-V Index performed extremely well during commodity bull markets, rising 440% since its inception on 12/10/2001 to its peak on 11/6/2007 versus a 31% increase in the S&P 500 over the same period. The TSX-V also rose 376% from its Global Financial Crisis (GFC) lows on 12/5/2008 to its high on 3/4/2011 versus a 51% gain for the S&P 500. But from its high on 3/4/2011 until 10/31/2024, the TSX-V came down 83% while the S&P 500 rose 332% over the same period. Note that the TSX-V is now trading below its 2008 GFC lows.
The 2008 GFC was an extraordinary economic event and scarred many mining investors’ memories. In our opinion, it makes them fearful of owning mining stocks during a broad stock market correction. The brief Covid Recession in 2020 where mining stocks declined is also etched in the memory of reluctant mining investors. Such fear is understandable but is also what we call “fighting the last war” because it ignores the potential extraordinary countercyclical benefits of owning gold miners that happened in other broad market selloffs like we showed above in 1929-1932, 1972-1974, and 2000-2002. Investor apprehension toward small cap mining stocks and greed towards large cap growth and technology stocks is what we believe is creating the value opportunity and countercyclical setup today that is similar to those earlier periods. In our analysis, a selloff in exploration miners like 2008 from today’s low valuations is highly improbable. Keep in mind that the 2008 TSX-V crash only happened after a sharp five-year 440% runup.
The S&P/TSX Venture Composite Index (“TSX-V Index”) has been in the wake of a nearly 14-year bear market and basing pattern since 2011. On a nominal basis, the TSX-V Index is already 18% below its 2008 GFC-worst levels. Meanwhile, on an inflation-adjusted basis, using the US Consumer Price Index, the TSX-V Index is currently 45% below its GFC lows, the exact opposite of bubble territory in our view.
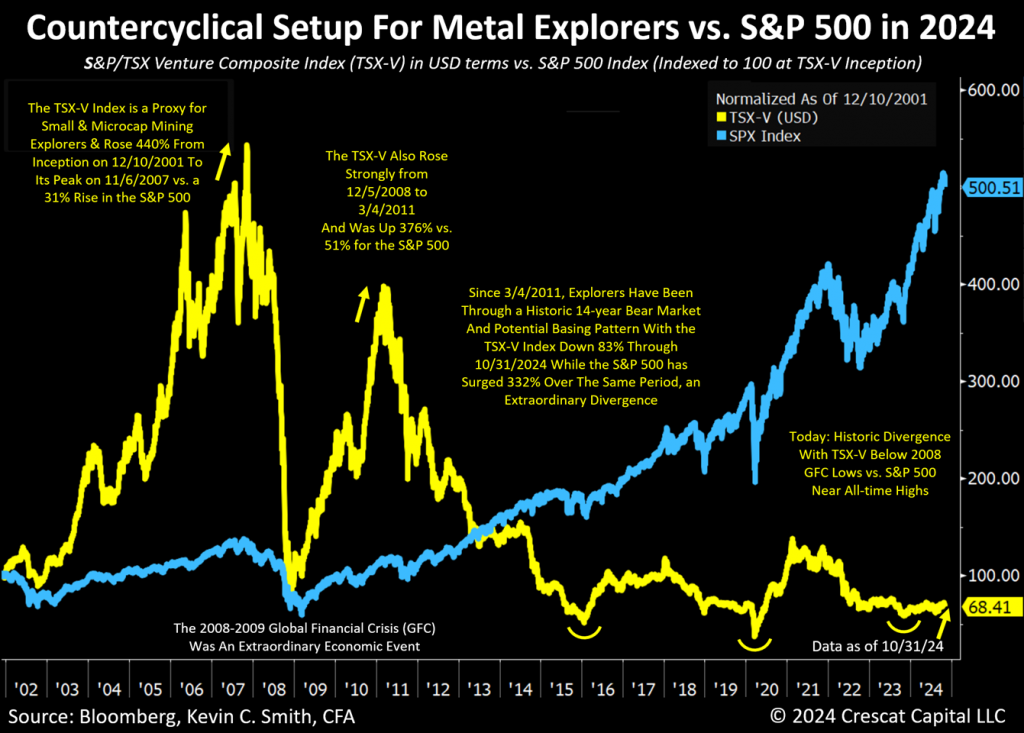
Crescat has identified the S&P/TSX Venture Composite Index (“TSX-V Index”) as the most appropriate and longest-running benchmark to serve as a proxy for the exploration segment of the mining industry. The data that follows is as of 10/31/24: There were 135 companies in the TSX-V Index. Their average market cap was USD 280M. 93 of these companies (69%) are in the mining & metals industry and have an average market cap of USD 198M. The TSX Index is a subset of the broader TSX Venture Composite Exchange (TSX-V Exchange) which has a total of 1,881 companies listed on it with an average market cap of USD 39M. To be included in the TSX-V Index, a security must have a relative weight of at least 0.20% of the total capitalization of the TSX-V Exchange. 981 of the companies on the TSX-V Exchange (52%) are in the mining & metals industry and have an average market cap of USD 32M. Because the mining & metals companies listed on the TSX-V Exchange tend to be exploration-focused as opposed to producing miners, they represent a large universe of publicly traded companies for Crescat to consider for its activist metals and mining investment theme which at this time has a deliberate emphasis on small and microcap explorers.
The Lag Could Be Your Friend
The recent lag in the performance of small and micro-cap precious metals exploration stocks as indicated by the performance of the TSX-V Index presents an extraordinary timing opportunity, in our opinion, compared to the recent breakouts in the price of gold and silver and larger cap miners for those looking for a strong catch-up and potential outperformance play in the early stages of what we believe will be another secular bull market for precious metals.
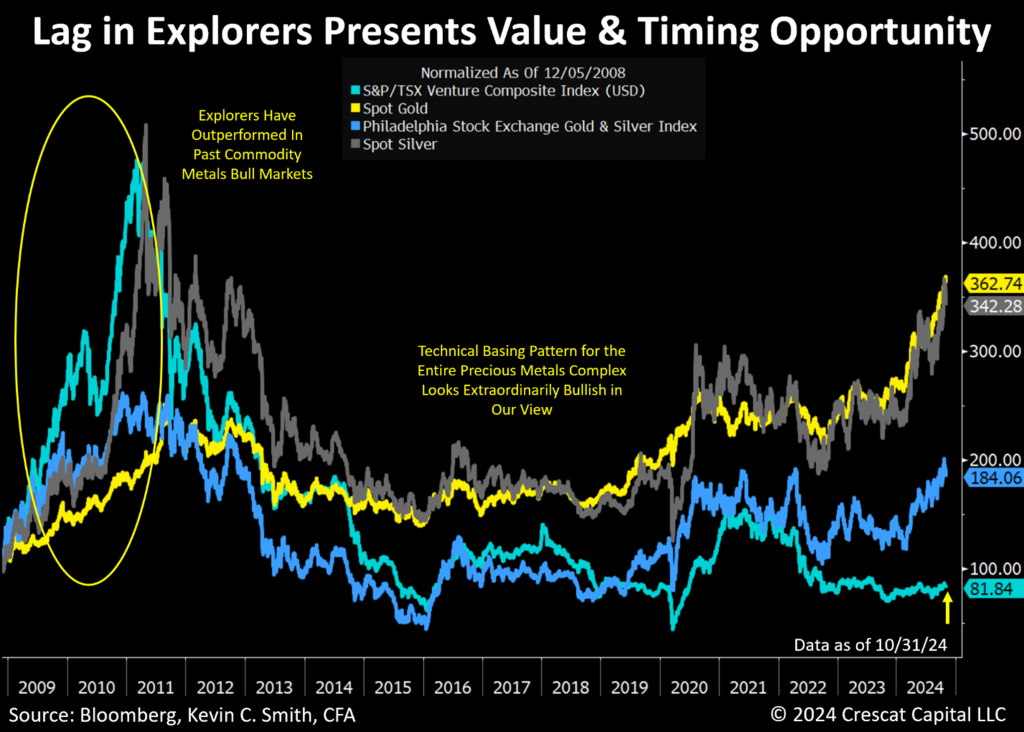
The Toronto Venture Composite Index (“TSX-V Index”) in the chart above serves as a proxy for the small and micro-cap exploration segment of the mining industry. The Philadelphia Gold and Silver Index (Nasdaq: XAU) is traded on the Philadelphia Stock Exchange and is made up of 30 precious metal mining companies.
Starting from low valuations, we believe the higher volatility of exploration mining stocks, as indicated in the two charts above, compared to other financial instruments can potentially work in one’s favor, like we saw in 2001 to 2007, in 2008 to 2011, and in our own precious metals fund from its inception on 8/1/2020 through May 31, 2021 when it climbed 251% net of fees in just eight months while it was substantially allocated to exploration mining stocks. See the end of this letter for full fund performance.
We carefully select and actively manage our portfolio of explorers through the fundamental analytical vetting of the Crescat Investment Team. Our team includes Quinton Hennigh, PhD, Crescat’s Geologic and Technical director, who has over 40 years of experience in the mining industry as an exploration geologist, executive, and investor. Many of Crescat’s holdings in the Crescat Precious Metals Fund, and firmwide across its activist metals portfolio theme, indeed have been listed on the Toronto Venture Exchange since the fund’s inception. Yet, Crescat’s Precious Metals Fund (CPMF) is up 150.1% (cumulative) net of fees since inception on 8/1/2020 through 9/30/2024 versus a 19.2% decline in the TSX-V Index in USD terms for the same period.
Valuation Risks to Megacap Technology Stocks and the S&P 500
The purpose of the next four charts is to highlight the historically high valuation risks in megacap technology stocks and the S&P 500 Index today in the context of current and past market and economic cycles. The analysis below is further designed to emphasize the potential benefits to investors of adding undervalued countercyclical gold mining stocks to one’s portfolio to counterbalance these risks.
Top 10 Megacap Tech Stocks
On an enterprise value to GDP basis, the valuation risk of the ten largest US megacap tech stocks is more than twice its top-ten counterparts at the peak of the 2000 Tech Bubble, 63.8% EV to GDP as of 10/29/2024 versus 28.4% EV to GDP on 3/27/2000.
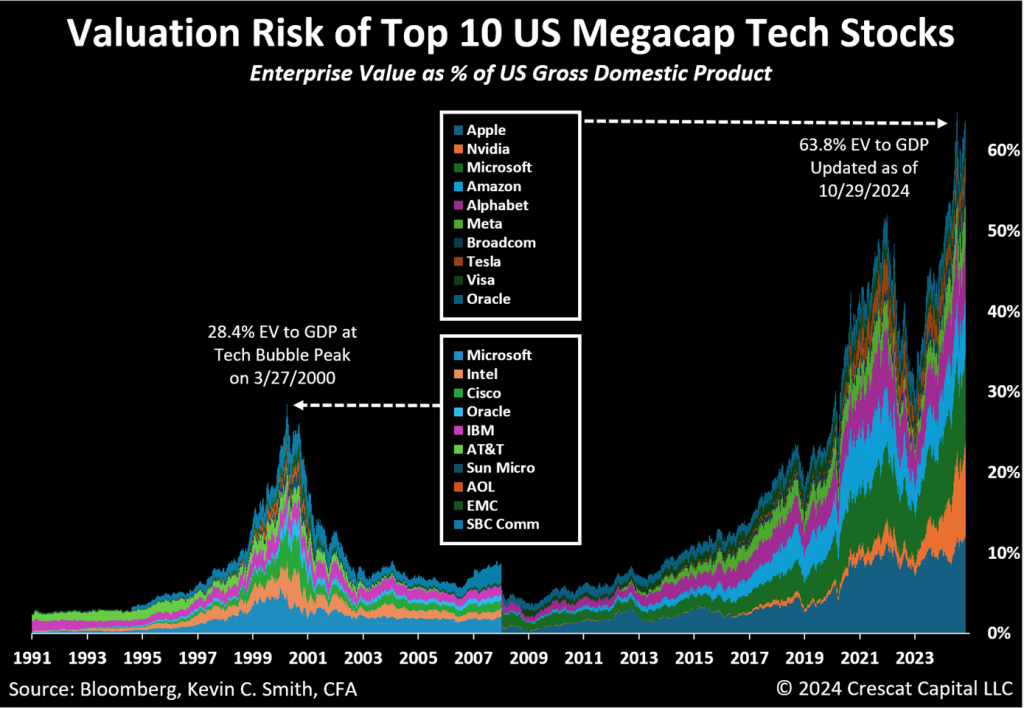
Disclosure: Crescat may or may not hold positions at any given time in the securities referenced herein. This is not a recommendation or endorsement to buy or sell any security. Information provided as of 10/29/24.
CAPE
Today Cyclically Adjusted Price-to-Earnings (CAPE) ratio for the S&P 500 is higher than it was at the 1929 stock market peak, immediately prior to its historic crash. The CAPE ratio was developed by Robert J. Shiller, a professor of economics at Yale University. With Eugene Fama and Lars Peter Hansen, Shiller received the 2013 Nobel Memorial Prize in Economic Sciences for empirical analysis of asset prices. The CAPE ratio is a valuation measure that compares the current price of a stock market index to its inflation-adjusted average earnings over the past ten years. It aims to smooth out short-term earnings fluctuations to provide a more stable, long-term view of market valuations. This metric provides investors with a tool to evaluate long-term market valuations while accounting for economic cycles and inflation.
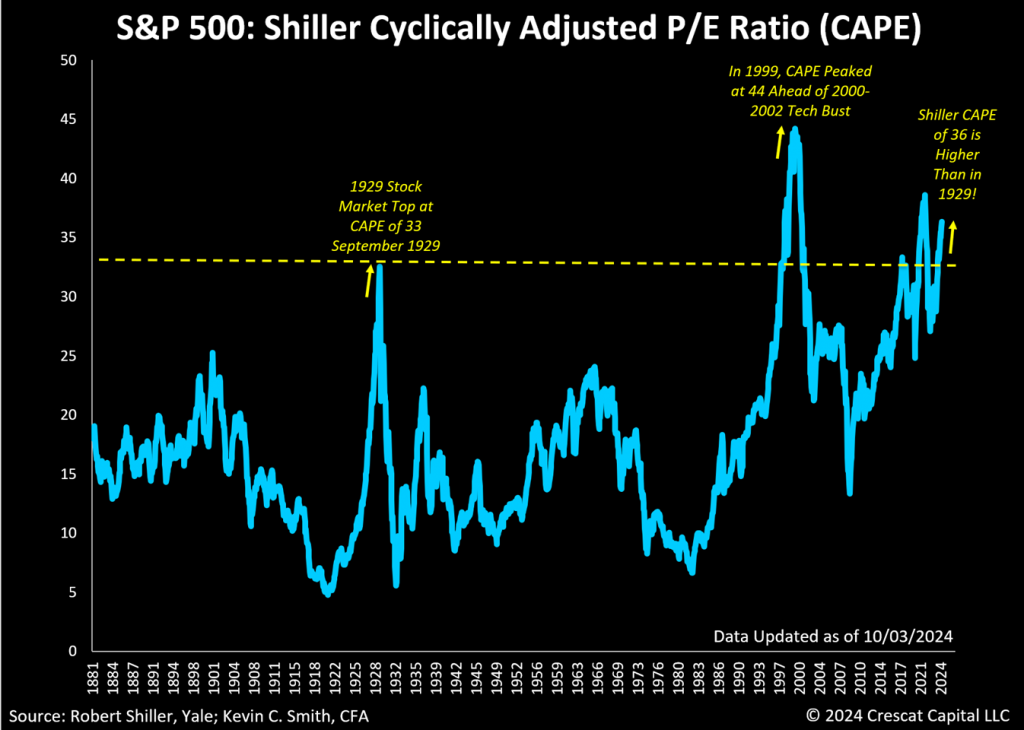
The formula for the Shiller CAPE ratio is Current Share Price ÷ 10-Year Average of Inflation-Adjusted Earnings.
MAPE
While CAPE ratio indicates that P/E ratios were higher in the 2000 tech bubble compared to today, such analysis is at odds with our EV-to-GDP analysis for megacap tech stocks shown above which indicates that valuation multiples today are higher than 2000. To reconcile this discrepancy, we turn to the concept behind John Hussman’s Margin-Adjusted P/E (MAPE) ratio which is to cyclically adjust for profit margins. John Hussman is a money manager with a PhD in economics from Stanford University. Profit margins are near historic highs today, so we believe a MAPE adjustment is critical to understanding the valuation and economic cycle risks in the market today. Like the Shiller CAPE, MAPE uses multiple years of earnings data to smooth out short-term fluctuations but avoids the fixed 10-year window of the Shiller CAPE. Note, Crescat’s MAPE calculation below uses 33 years of data to calculate average long-term profit margins versus today’s profit margins which are historically high in comparison and therefore should be cyclically adjusted. Crescat’s MAPE does not include an inflation adjustment like Shiller CAPEs and Hussman MAPEs. We believe cyclical swings in inflation are already accounted for within the cyclical swings of profit margins. What is important to understand is that P/Es are higher than they were at the top of the 1999 to 2000 tech bubble today when using MAPE. Thus, we have shown that valuations for the S&P 500 are higher today than both the 1929 and the 2000 stock market peaks.
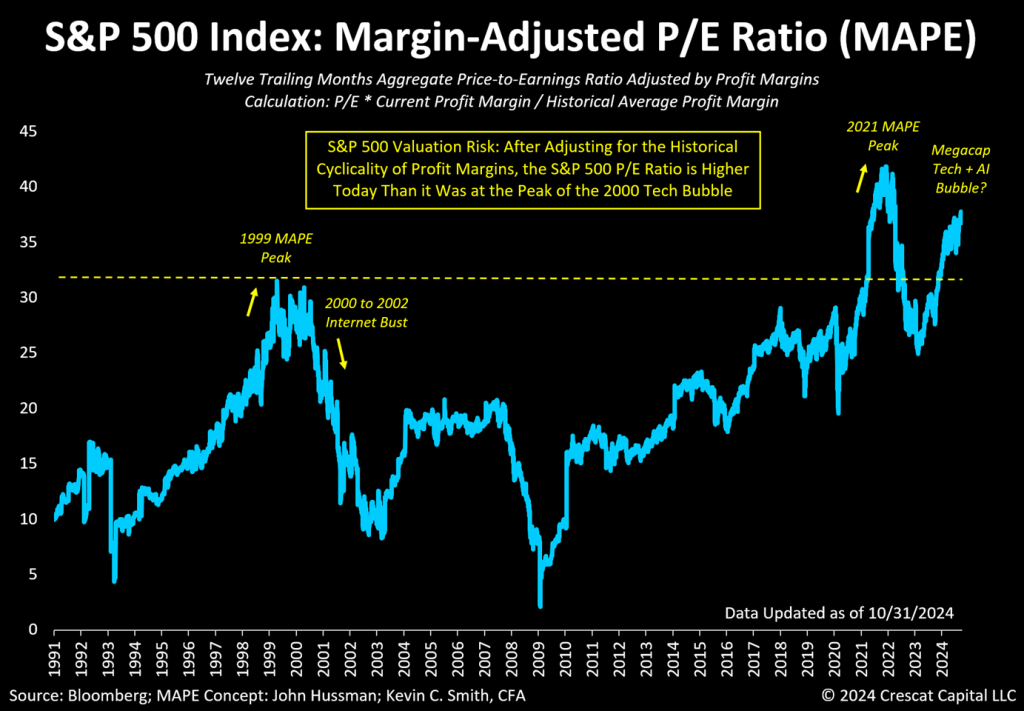
Crescat’s MAPE is calculated as the S&P 500 twelve trailing months aggregate price-to-earnings ratio adjusted by profit margins: P/E x Current Profit Margin / Historical average profit margin over the entire 33-year series.
Capex Trends Are Also Critical to Understanding Business Cycle Risks and Opportunities
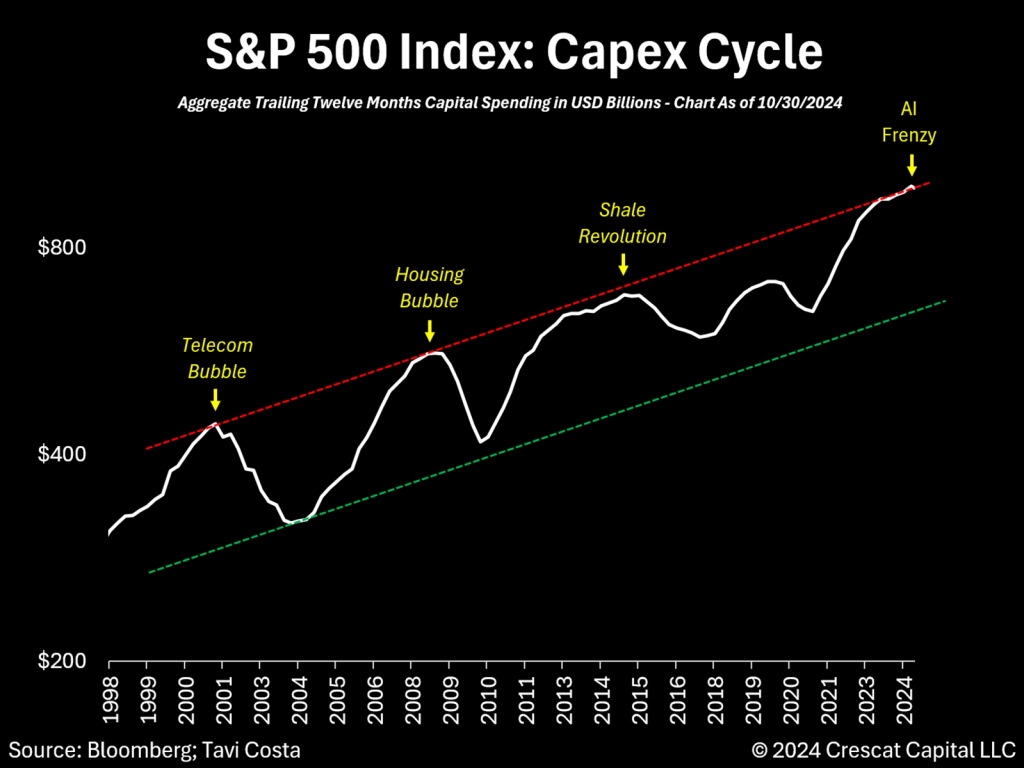
Approximately every 7 to 10 years, significant infrastructure expansions drive macro trends. In the 1990s, extensive spending on computer networking, servers, and telecommunications equipment infrastructure drove the Internet revolution. Aggregate capital expenditure peaked along with the speculative stock market environment in 2000 leading to a tech bust and recession that hit sharply in 2001.
In the next economic cycle, capital investment shifted to residential real estate. As is often the case with speculative bubbles, this expansion hit a debt wall that led to the 2008 Global Financial Crisis. The next cycle emerged with the shale revolution, requiring substantial capital investment to support the US’s path to becoming the world’s largest oil producer. Yet this expansion also had its consequences: oil companies overbuilt and production outpaced demand. That, combined with a slowdown in the Chinese economy that year, led to a collapse in the energy sector in 2015 and a global recession outside the US.
Recent breakthroughs in generative artificial intelligence (AI), have spurred a capital spending race among technology service providers to build expensive data centers and cloud service platforms for AI training and inference services. Some Wall Street analysts are now calling into question the prospects for a meaningful return on investment in the near term for these so-called “hyperscalers”. Given both high hopes and high valuations for many of these large-cap companies after their incredible success over an unusually long cycle that started as far back as 2009, we believe there is a high risk of a broad US stock market and economic inflection analogous to the 2000 Internet and telecom bubble.
Disclosure: Crescat may or may not hold positions at any given time in the securities referenced herein. This is not a recommendation or endorsement to buy or sell any security or other financial instrument. Past performance is not a guarantee or indicator of future results.
Gold Miners Capex Cycle
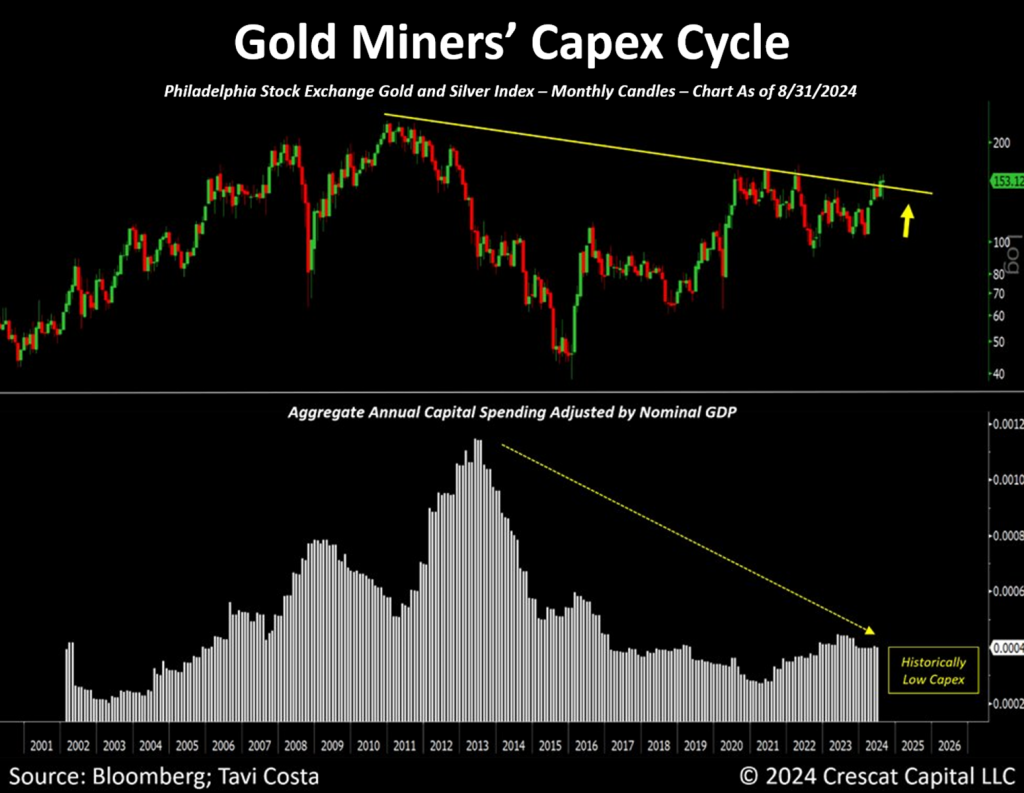
Note how the capex cycle for the gold mining industry as shown in the chart below runs counter to that of the S&P 500 at large as shown in the chart above. The long declining trend of capital investment into mining from 2014 through 2021 is a setup for a significant macro supply-demand imbalance in favor of a structural commodity metals bull market. It can take over a decade to discover, permit, and develop a new mine, so because of the lack of past investment, it will take years for the mining industry to ramp up production to meet the demands of the global economy. Without the supply to meet this demand, metals prices are likely to trend higher for a multi-year cycle.
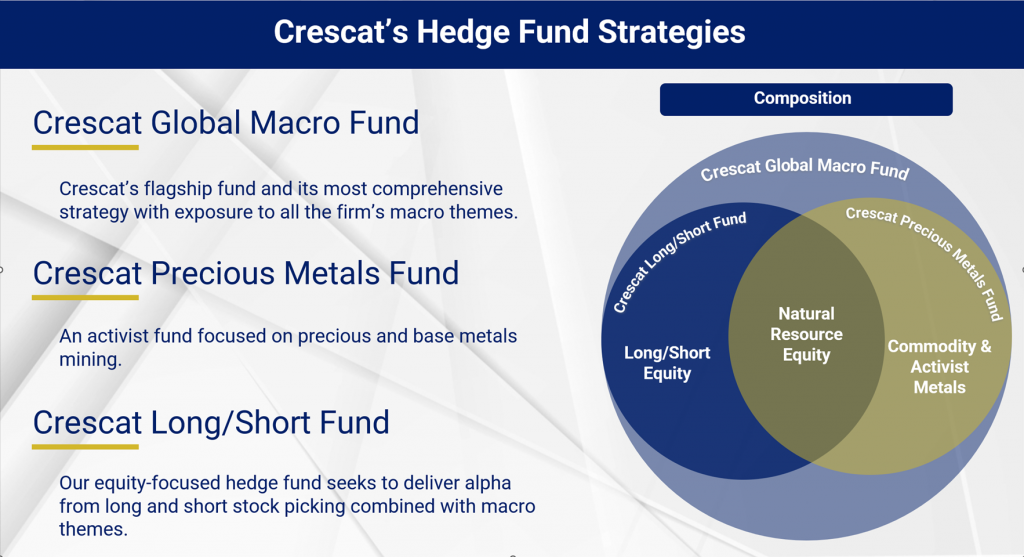
Crescat’s Hedge Fund Strategies, Investment Process, and Macro Themes
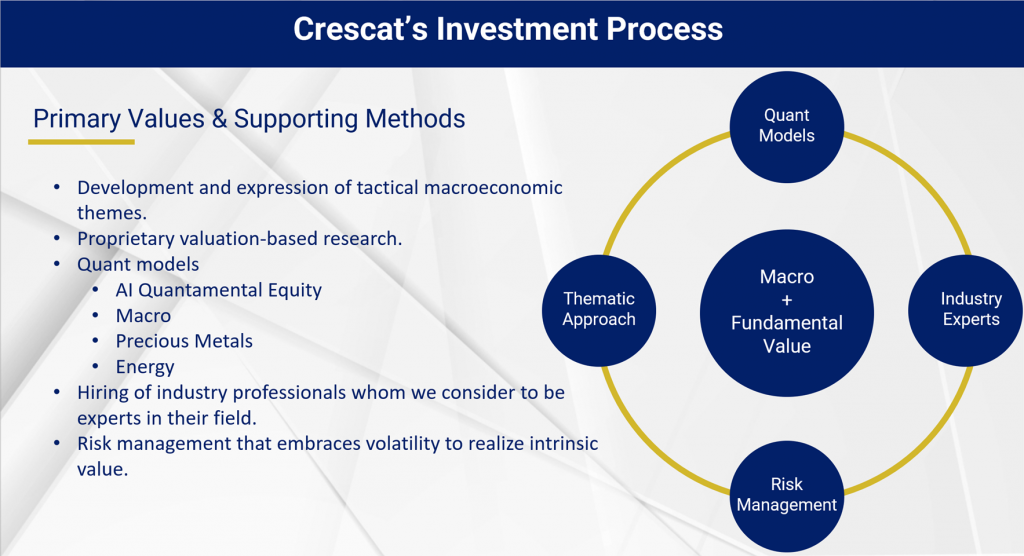
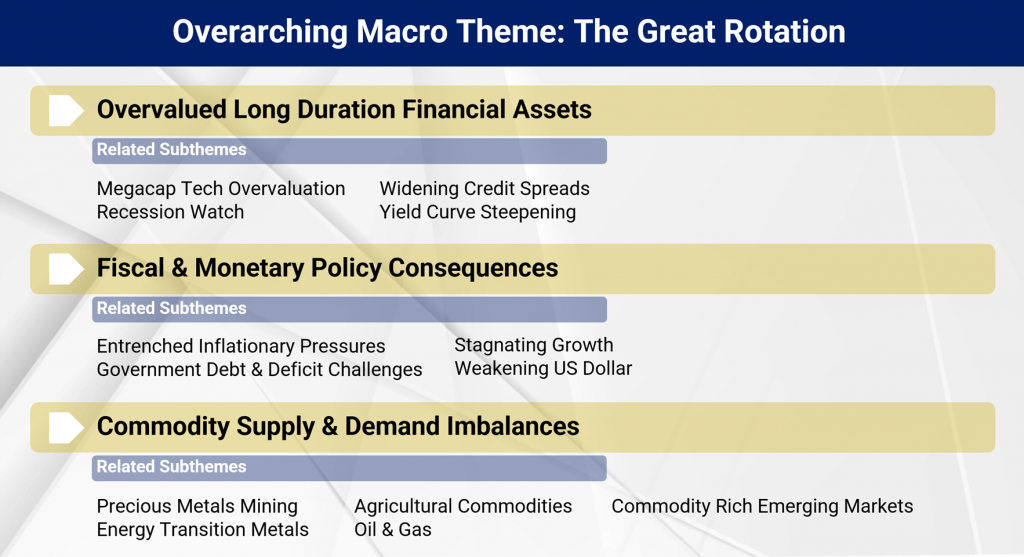
Performance
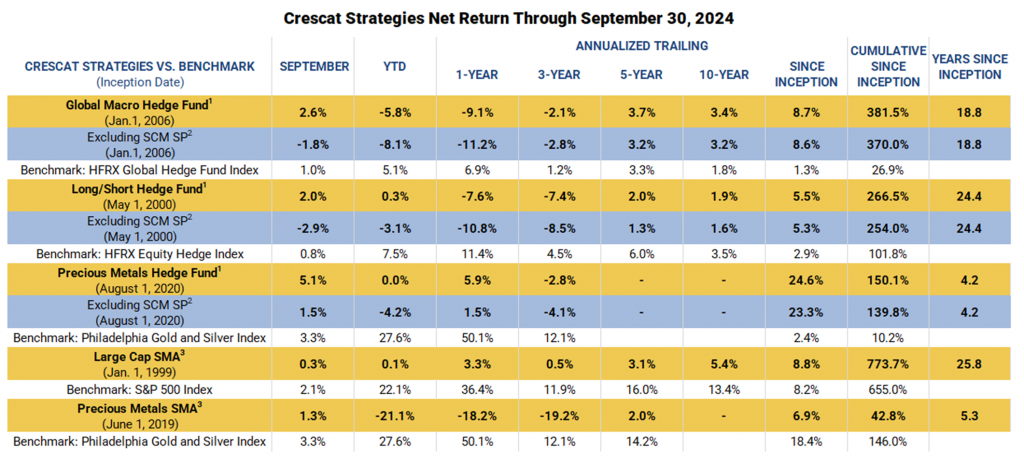
Performance data represents past performance, and past performance does not guarantee future results. Performance data is subject to revision following each monthly reconciliation and/or annual audit. Individual performance may be lower or higher than the performance data presented. The currency used to express performance is U.S. dollars. Before January 1, 2003, the results reflect accounts managed at a predecessor firm. See additional performance disclosures below.
We encourage you to reach out to any of us listed below if you would like to learn more about how our investment vehicles might fit with your individual needs and objectives.
Sincerely,
Kevin C. Smith, CFA
Founding Member & Chief Investment Officer
Tavi Costa
Member & Macro Strategist
Quinton T. Hennigh, PhD
Member & Geologic and Technical Director
For more information including how to invest, please contact:
Marek Iwahashi
Head of Investor Relations
miwahashi@crescat.net
(720) 323-2995
Linda Carleu Smith, CPA
Co-Founding Member & Chief Operating Officer
lsmith@crescat.net
(303) 228-7371
© 2024 Crescat Capital LLC
Important Disclosures
The purpose of this letter is to provide access to analyses prepared by Crescat Portfolio Management LLC (“CPM”) with respect to certain companies (“Issuers”) in which CPM and certain of the Funds and accounts it manages are shareholders. The letters enable CPM to share macro themes and newsworthy geologic updates, good and bad, across our Issuers as they arise. The letters represent the opinions of CPM, as an exploration industry advocate, on the overall geologic progress of our activist strategy in creating new economic metal deposits in viable mining jurisdictions around the world. Each issuer discussed has been selected solely for this purpose and has not been selected on the basis of performance or any performance-related criteria. The securities discussed herein do not represent an entire portfolio and in the aggregate may only represent a small percentage of a strategies holdings. The Issuers discussed may or may not be held in such portfolios at any given time. The Issuers discussed do not represent all of the investments purchased or sold by Funds managed by CPM. It should not be assumed that any or all of these investments were or will be profitable.
Projected results and statements contained in this letter that are not historical facts are based on current expectations and involve risks, uncertainties and other factors that may cause actual results, performance or achievements to be materially different from any future results. While investing in the mining industry is inherently risk, CPM believes that under a professionally managed portfolio approach with the guidance of Quinton Hennigh, PhD, CPM’s full-time Geologic and Technical Director, and our proprietary exploration and mining model, we will be able to generate long-term capital appreciation.
These opinions are current opinions as of the date appearing in the relevant material and are subject to change without notice. The information contained in the letters is based on publicly available information with respect to the Issuers as of the date of such white papers and has not been updated since such date.
This letter is not intended to be, nor should it be construed as, an offer to sell or a solicitation of an offer to buy any security. The information provided in this letter is not intended as investment advice or recommendation to buy or sell any type of investment, or as an opinion on, or a suggestion of, the merits of any particular investment strategy.
This letter is not intended to be, nor should it be construed as, a marketing or solicitation vehicle for CPM or its Funds. The information herein does not provide a complete presentation of the investment strategies or portfolio holdings of the Funds and should not be relied upon for purposes of making an investment or divestment decision with respect to the Funds. Those who are considering an investment in the Funds should carefully review the relevant Fund’s offering memorandum and the information concerning CPM, including its SEC Form ADV Brochure which is available at: www.adviserinfo.sec.gov.
This presentation should not be construed as legal, tax, investment, financial or other advice. It does not have regard to the specific investment objective, financial situation, suitability, or the particular need of any specific person who may receive this presentation and should not be taken as advice on the merits of any investment decision. The views expressed in this presentation represent the opinions of CPM and are based on publicly available information with respect to the Issuer. CPM recognizes that there may be confidential information in the possession of the Issuer that could lead the Issuer to disagree with CPM’s conclusions.
CPM currently beneficially owns, and/or has an economic interest in, shares of the Issuers discussed in these letters. Therefore, CPM’s clients, principals and employees may stand to realize significant gains or losses if the price of the companies’ securities move. After the publication or posting of any video, CPM, its principals and employees will continue transacting in the securities discussed, and may be long, short or neutral at any time thereafter regardless of their initial position or recommendation. While certain individuals affiliated with CPM are current or former directors of certain of the Issuers referred to herein, none of the information contained in this presentation or otherwise provided to you is derived from non-public information of such publicly traded companies. CPM has not sought or obtained consent from any third party to use any statements or information indicated herein that have been obtained or derived from statements made or published by such third parties.
The estimates, projections, pro forma information and potential impact of CPM’s analyses set forth herein are based on assumptions that CPM believes to be reasonable as of the date of this presentation, but there can be no assurance or guarantee (i) that any of the proposed actions set forth in this presentation will be completed, (ii) that actual results or performance of the Issuer will not differ, and such differences may be material or (iii) that any of the assumptions provided in this presentation are accurate.
All content posted on CPM’s letters including graphics, logos, articles, and other materials, is the property of CPM or others and is protected by copyright and other laws. All trademarks and logos are the property of their respective owners, who may or may not be affiliated with CPM. Nothing contained on CPM’s website or social media networks should be construed as granting, by implication, estoppel, or otherwise, any license or right to use any content or trademark displayed on any site without the written permission of CPM or such other third party that may own the content or trademark displayed on any site.
Performance
Performance data represents past performance, and past performance does not guarantee future results. Performance data is subject to revision following each monthly reconciliation and/or annual audit. Individual performance may be lower or higher than the performance data presented. The currency used to express performance is U.S. dollars. Before January 1, 2003, the results reflect accounts managed at a predecessor firm.
1 – Net returns reflect the performance of an investor who invested from inception and is eligible to participate in new issues and side pocket investments. Net returns reflect the reinvestment of dividends and earnings and the deduction of all expenses and fees (including the highest management fee and incentive allocation charged, where applicable). An actual client’s results may vary due to the timing of capital transactions, high watermarks, and performance.
2 – Performance figures presented Excluding SCM SP represent the fund’s net returns calculated without the impact of the San Cristobal Mining, Inc. side pocket that was designated on July 1st, 2024. The side pocket includes a private equity asset that is not available to new investors in the funds on or after July 1, 2024. Excluding these assets provides a clearer view of the performance to investors coming into the funds after that date. New investors cannot participate in the SCM Side Pocket and will not share in its potential gains or losses. Investors should consider both the overall performance and the performance excluding the side pocket when evaluating the fund’s returns.
3 – The SMA composites include all accounts that are managed according to CPM’s precious metals or large cap SMA strategy over which it has full discretion. Investment results shown are for taxable and tax-exempt accounts. Any possible tax liabilities incurred by the taxable accounts are not reflected in net performance. Performance results are time weighted and reflect the deduction of advisory fees, brokerage commissions, and other expenses that a client would have paid, and includes the reinvestment of dividends and other earnings. 14
Risks of Investment Securities: Diversity in holdings is an important aspect of risk management, and CPM works to maintain a variety of themes and equity types to capitalize on trends and abate risk. CPM invests in a wide range of securities depending on its strategies, as described above, including but not limited to long equities, short equities, mutual funds, ETFs, commodities, commodity futures contracts, currency futures contracts, fixed income futures contracts, private placements, precious metals, and options on equities, bonds and futures contracts. The investment portfolios advised or sub-advised by CPM are not guaranteed by any agency or program of the U.S. or any foreign government or by any other person or entity. The types of securities CPM buys and sells for clients could lose money over any timeframe. CPM’s investment strategies are intended primarily for long-term investors who hold their investments for substantial periods of time. Prospective clients and investors should consider their investment goals, time horizon, and risk tolerance before investing in CPM’s strategies and should not rely on CPM’s strategies as a complete investment program for all of their investable assets. Of note, in cases where CPM pursues an activist investment strategy by way of control or ownership, there may be additional restrictions on resale including, for example, volume limitations on shares sold. When CPM’s private investment funds or SMA strategies invest in the precious metals mining industry, there are particular risks related to changes in the price of gold, silver and platinum group metals. In addition, changing inflation expectations, currency fluctuations, speculation, and industrial, government and global consumer demand; disruptions in the supply chain; rising product and regulatory compliance costs; adverse effects from government and environmental regulation; world events and economic conditions; market, economic and political risks of the countries where precious metals companies are located or do business; thin capitalization and limited product lines, markets, financial resources or personnel; and the possible illiquidity of certain of the securities; each may adversely affect companies engaged in precious metals mining related businesses. Depending on market conditions, precious metals mining companies may dramatically outperform or underperform more traditional equity investments. In addition, as many of CPM’s positions in the precious metals mining industry are made through offshore private placements in reliance on exemption from SEC registration, there may be U.S. and foreign resale restrictions applicable to such securities, including but not limited to, minimum holding periods, which can result in discounts being applied to the valuation of such securities. In addition, the fair value of CPM’s positions in private placements cannot always be determined using readily observable inputs such as market prices, and therefore may require the use of unobservable inputs which can pose unique valuation risks. Furthermore, CPM’s private investment funds and SMA strategies may invest in stocks of companies with smaller market capitalizations. Small- and medium-capitalization companies may be of a less seasoned nature or have securities that may be traded in the over-the-counter market. These “secondary” securities often involve significantly greater risks than the securities of larger, better-known companies. In addition to being subject to the general market risk that stock prices may decline over short or even extended periods, such companies may not be well-known to the investing public, may not have significant institutional ownership and may have cyclical, static or only moderate growth prospects. Additionally, stocks of such companies may be more volatile in price and have lower trading volumes than larger capitalized companies, which results in greater sensitivity of the market price to individual transactions. CPM has broad discretion to alter any of the SMA or private investment fund’s investment strategies without prior approval by, or notice to, CPM clients or fund investors, provided such changes are not material.
Benchmarks
PHILADELPHIA STOCK EXCHANGE GOLD AND SILVER INDEX. The Philadelphia Stock Exchange Gold and Silver Index is the longest running index of global precious metals mining stocks. It is a diversified, capitalization-weighted index of the leading companies involved in gold and silver mining. It is a suitable benchmark for the Crescat Precious Metals private fund and the Crescat Precious Metals SMA strategy, which have also been predominately composed of precious metals mining companies involved in gold and silver mining since inception.
S&P 500 INDEX. The S&P 500 Index is perhaps the most followed stock market index. It is considered representative of the U.S. stock market at large. It is a market cap-weighted index of the 500 largest and most liquid companies listed on the NYSE and NASDAQ exchanges. While the companies are U.S. based, most of them have broad global operations. Therefore, the index is representative of the broad global economy. It is a suitable benchmark for the Crescat Global Macro and Crescat Long/Short private funds, and the Large Cap and Precious Metals SMA strategies, which have also traded extensively in large, highly liquid global equities through U.S.-listed securities, and in companies Crescat believes are on track to achieve that status. The S&P 500 Index is also used as a supplemental benchmark for the Crescat Precious Metals private fund and Precious Metals SMA strategy because one of the long-term goals of the precious metals strategy is low correlation to the S&P 500.
Standard and Poor’s 500 Metals & Mining Index is a capitalization-weighted index. The index was developed with a base level of 10 for the 1941-43 base period. The parent index is SPXL3. This is a GICS Level 3 Industries. Intraday values are calculated by Bloomberg and not supported by S&P DJI, however the close price in HP<GO> is the official close price calculated by S&P DJI.
The Consumer Price Index (CPI) is a measure of the average change over time in the prices paid by urban consumers for a market basket of consumer goods and services.
Global Money Supply is the total amount of monetary assets available in the economy at a given time. This index measures the entire stock of currency and other liquid instruments in circulation in an economy at a specific point in time. It includes cash in circulation (physical currency), bank deposits that can be easily converted to cash, other liquid assets, depending on the specific measure used. This index calculates the aggregate money supply across the entire global economy measured by Bloomberg.
References to indices, benchmarks or other measures of relative market performance over a specified period of time are provided for your information only. Reference to an index does not imply that the fund or separately managed account will achieve returns, volatility or other results similar to that index. The composition of an index may not reflect the manner in which a portfolio is constructed in relation to expected or achieved returns, portfolio guidelines, restrictions, sectors, correlations, concentrations, volatility or tracking.
Separately Managed Account (SMA) disclosures: The Crescat Large Cap Composite and Crescat Precious Metals Composite include all accounts that are managed according to those respective strategies over which the manager has full discretion. SMA composite performance results are time-weighted net of all investment management fees and trading costs including commissions and non-recoverable withholding taxes. Investment management fees are described in CPM’s Form ADV 2A. The manager for the Crescat Large Cap strategy invests predominantly in equities of the top 1,000 U.S. listed stocks weighted by market capitalization. The manager for the Crescat Precious Metals strategy invests predominantly in a global all-cap universe of precious metals mining stocks.
Hedge Fund disclosures: Only accredited investors and qualified clients will be admitted as limited partners to a CPM hedge fund. For natural persons, investors must meet SEC requirements including minimum annual income or net worth thresholds. CPM’s hedge funds are being offered in reliance on an exemption from the registration requirements of the Securities Act of 1933 and are not required to comply with specific disclosure requirements that apply to registration under the Securities Act. The SEC has not passed upon the merits of or given its approval to CPM’s hedge funds, the terms of the offering, or the accuracy or completeness of any offering materials. A registration statement has not been filed for any CPM hedge fund with the SEC. Limited partner interests in the CPM hedge funds are subject to legal restrictions on transfer and resale. Investors should not assume they will be able to resell their securities. Investing in securities involves risk. Investors should be able to bear the loss of their investment. Investments in CPM’s hedge funds are not subject to the protections of the Investment Company Act of 1940.
Investors may obtain the most current performance data, private offering memoranda for CPM’s hedge funds, and information on CPM’s SMA strategies, including Form ADV Part 2 and 3, by contacting Linda Smith at (303) 271-9997 or by sending a request via email to lsmith@crescat.net. See the private offering memorandum for each CPM hedge fund for complete information and risk factors.