The History of US Dollar Cycles
Macro regime shifts often stem from systemic imbalances, where excessive concentration of capital in certain sectors, asset classes, or currencies reaches saturation points, leading to a major reallocation of resources. These transitions are often closely tied to the cyclical nature of the US dollar (USD), which serves as a cornerstone of the global financial system, influencing nearly every market worldwide.
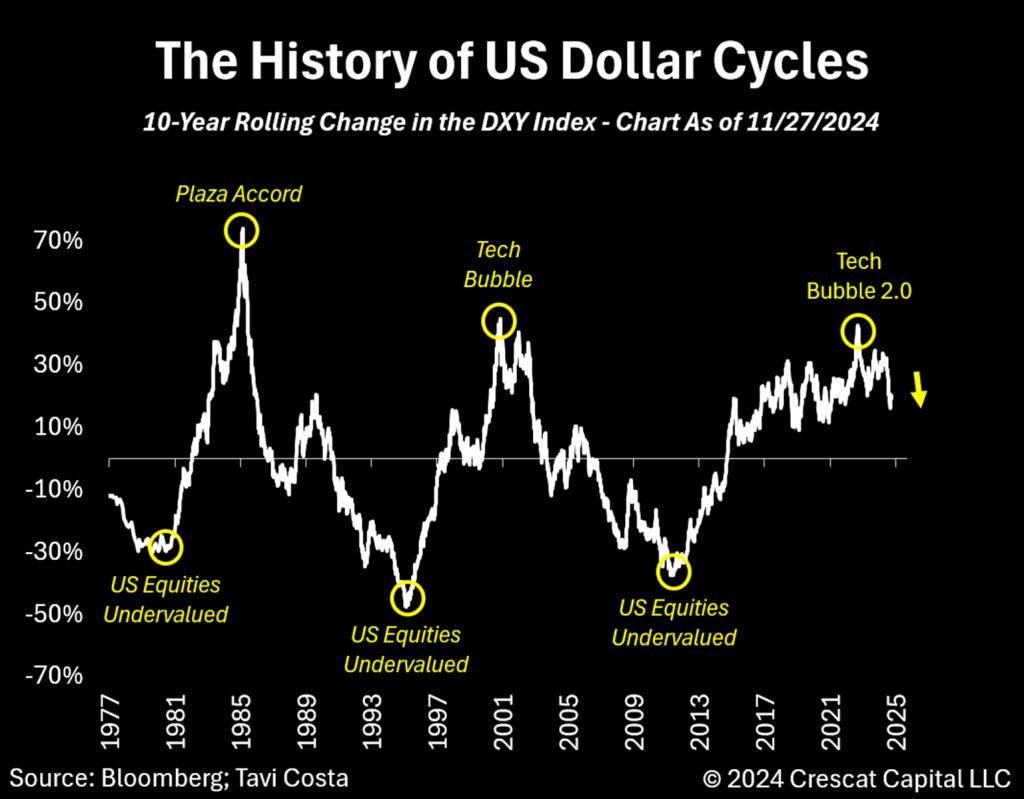
Since the 1971 end of the gold standard, the dollar’s cycles have been notably prolonged and distinct, marked by clear fluctuations between periods of strength and weakness. Today, a new set of structural pressures has brought the USD to a critical juncture. The growing challenge of managing unsustainable interest payments has created conditions that could drive a significant devaluation. The likely policy response—a combination of reduced government spending and lower interest rates—has historically weakened the dollar, especially relative to hard assets and other currencies.
These dynamics, shaped by enduring fiscal and monetary policy constraints, suggest the dollar is nearing a structurally driven and substantial downward transition.
USD: The Axis of the Global Economy
The cyclical nature of the US dollar often aligns with broad secular shifts in global asset markets. Historical episodes illustrate this dynamic, with the dollar’s trends serving as both a reflection and catalyst for evolving economic and financial landscapes.
In the 1970s, amid high inflation and tighter monetary policy, the dollar entered a prolonged bear market, exemplified by the DXY index’s 31.7% decline from 1971 to 1978. During this time, commodities and natural resource companies thrived, while US equities underperformed relative to international markets. The subsequent disinflationary environment of the 1980s reversed this trend, as capital flowed into US assets, boosting the dollar by 95.7% from 1980 to 1985. However, the dollar’s strength became a concern, prompting global policymakers to negotiate the Plaza Accord to curb its appreciation.
By 1985, the dollar’s peak marked a shift in market dynamics, with Japan benefiting significantly during its “Bubble Economy”. The eventual collapse of this speculative phase represented a reversal of the preceding trend, aligning with a prolonged bottoming process for the dollar and a gradual revaluation of US equities. The 1990s then ushered in the “Tech Bubble” era, where technological innovation and growth stocks propelled US markets to unprecedented heights, driving significant dollar strength.
Yet the bursting of the Tech Bubble in 2000 marked another pivotal shift. Commodities, long neglected, began a powerful bull market, and emerging markets, notably driven by China experienced historic expansions. For instance, in US dollar terms, Brazil’s Ibovespa index surged 1,871% including dividends between 2002 and 2008.
Following the 2008 financial crisis, global capital flows shifted dramatically back to US assets. The dollar strengthened, US stocks surged, and Treasuries outperformed, while commodities and emerging markets faltered. This era exemplifies the Milkshake Theory by Brent Johnson, which suggests that the dollar’s global dominance stems from its ability to draw liquidity from other markets, reinforcing US economic resilience.
The cyclical nature of these shifts offers a valuable framework for analysis, though timing their transitions remains inherently challenging. Dollar uptrends often align with periods of US equity outperformance, particularly in growth-oriented sectors supported by technological advancements. These phases are marked by elevated valuations and concentrated capital flows into US markets.
Conversely, dollar downturns frequently favor gold, undervalued international equities, and commodities, with emerging markets and value-oriented strategies regaining prominence. Current developments hint at a maturing cycle for the dollar.
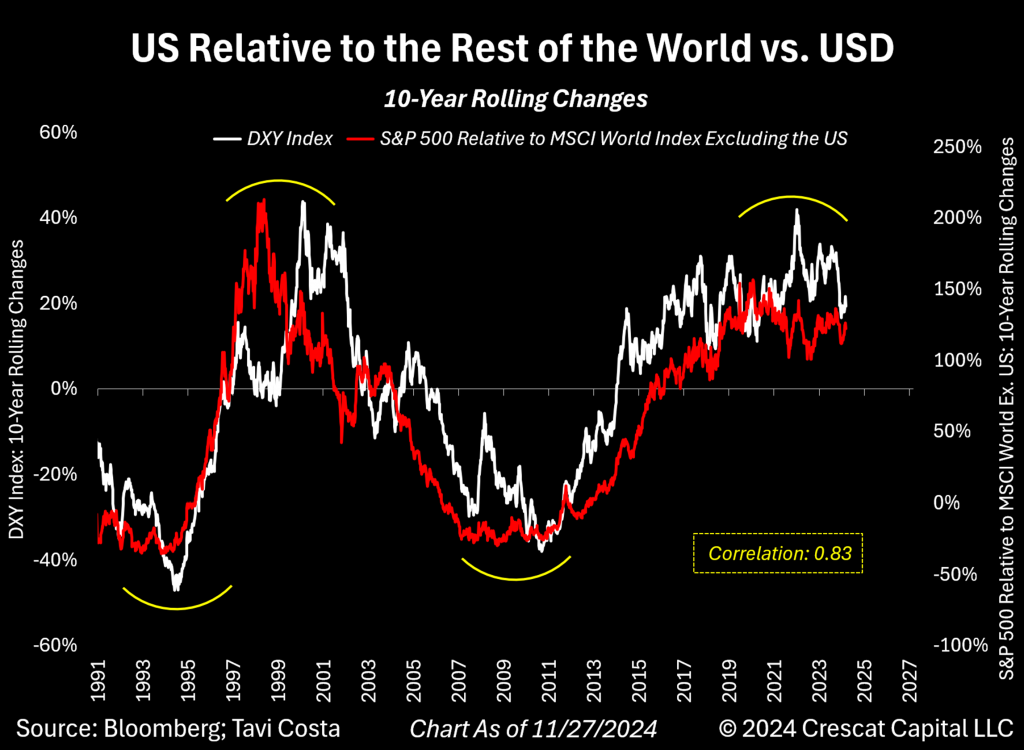
Observe in this chart, for example, the 10-year rolling performance of the US dollar, as measured by the DXY index, demonstrates a strong correlation (0.85) with the ratio of the S&P 500 to the MSCI World Index over the past three decades. Both lines now appear to be reversing direction, which may indicate a potential shift in the dollar’s trend.
American Exceptionalism or Fiscal Irresponsibility?
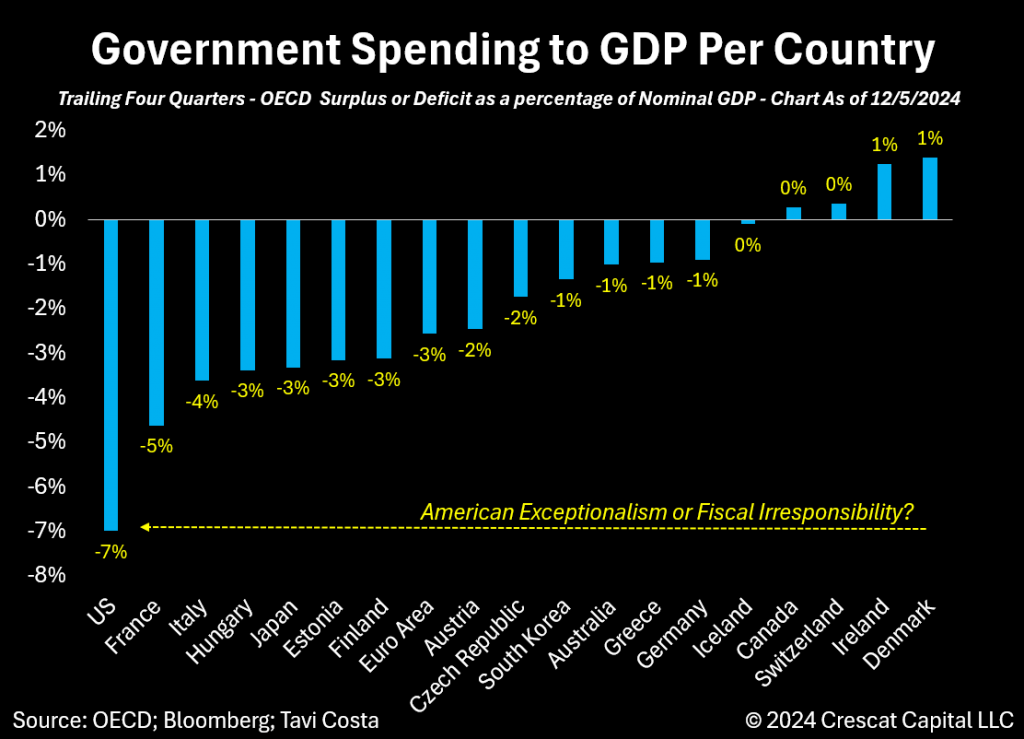
The U.S. economy has enjoyed one of its strongest periods of outperformance, both as a financial market and as an economic powerhouse, compared to the rest of the world. While there are various reasons for this, such as significant technological advancements, the primary driver has been aggressive fiscal spending relative to other economies.
Investors should consider a critical question:
Can the US. sustain such policies over the long term? What would reduced government spending mean for the trajectory of the US economy? We remain highly skeptical about the sustainability of this growth relative to the rest of the world in the years ahead.
An Unsustainable Path
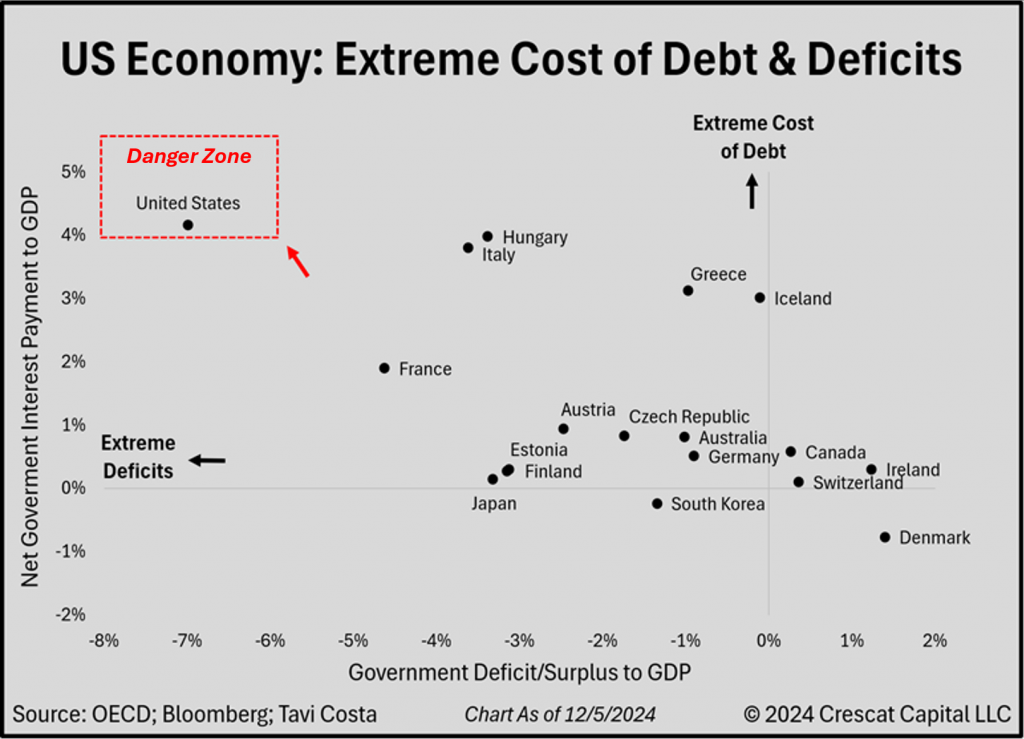
No major economy in the world today is pursuing such an aggressively expansionary fiscal policy while shouldering an unsustainable cost of debt service. This trajectory, in our view, is untenable and will inevitably lead to policies of interest rate suppression and constrained government spending—signaling a pivotal moment for the U.S. dollar’s strength. This is a stark reflection of why the dollar has become increasingly vulnerable in the current macro landscape, shedding its long-held reputation as the “cleanest dirty shirt.”
Constructing the Narrative of a Dollar Peak
As highlighted earlier, identifying inflection points in dollar trends is inherently complex and far from straightforward. While asset movements often exhibit some level of synchronization depending on the phase of the cycle, these shifts rarely occur simultaneously, particularly at pivotal turning points. This nuanced pattern appears to be unfolding today.
For instance, the ascent of gold has historically served as a compelling indicator of a potential dollar peak, especially when the metal demonstrates significant outperformance against US Treasuries during periods of market turmoil. However, this is only part of the picture. The revival of commodities is another critical development. This market segment often aligns with broader secular shifts in the gold market but also operates with its own distinct dynamics.
A defining characteristic of a commodity bull market is the rotational pattern of leadership, where various commodities take turns driving performance as the cycle unfolds. Energy commodities were the initial movers in 2021, followed by surges in lumber and ammonia prices. Agricultural commodities gained momentum, lithium experienced a sharp rise, orange juice prices soared, and more recently, copper has taken center stage. These moves are not isolated or disconnected; rather, they are intricately linked and, in our view, represent yet another indicator of a broader transformational shift underway.
Take note of the developments in the Indian market. After years of volatile yet largely sideways movement since the global financial crisis, India’s equity market has surged post-COVID, drawing substantial capital and attention—even as other emerging markets have yet to follow a similar trajectory, at least for now. These trends, in our view, are not isolated. When capital flows successfully into one emerging market, it often seeks comparable opportunities elsewhere. We believe it won’t be long before historically undervalued emerging markets become attractive alternatives. Some forward-looking investors have already begun allocating capital to markets like Argentina. In our opinion, it’s only a matter of time before this momentum extends to other emerging economies.
Additionally, valuation, while not a precise approach for timing, offers a clear perspective on extreme capital shifts across global markets. At some juncture, capital becomes so concentrated in one region that a reversal becomes almost inevitable, as smart money begins migrating toward neglected markets. These undervalued assets naturally reflect an environment where interest has been disproportionately one-sided for far too long.
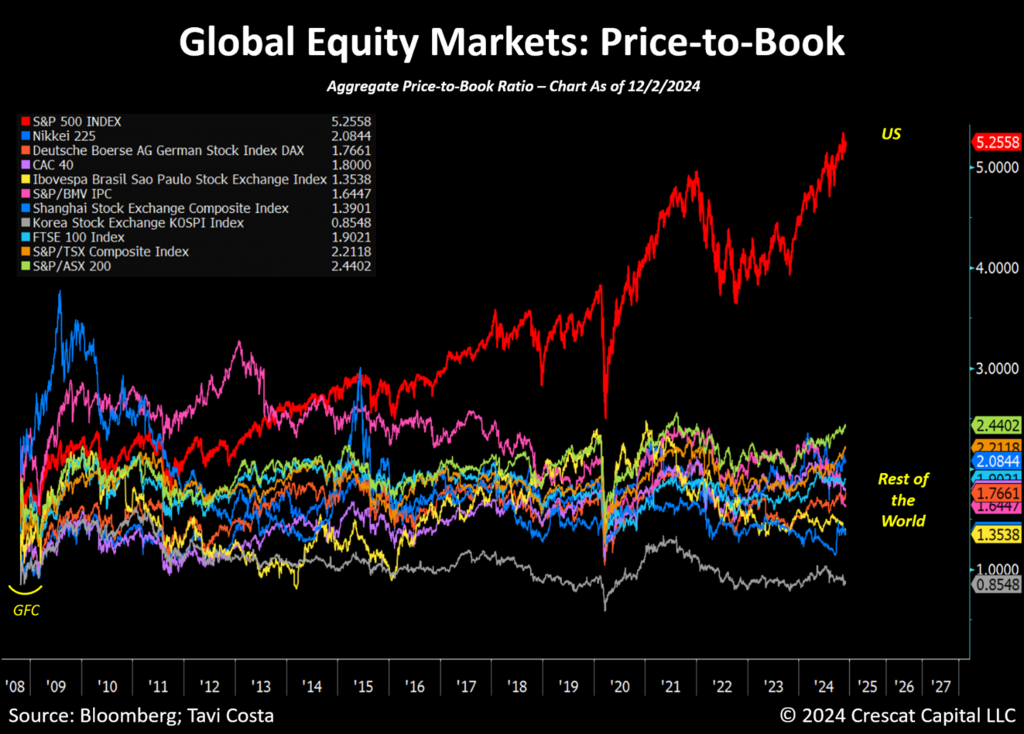
From this vantage point, it’s evident that we’re living through one of the most extreme periods in history for US equity markets relative to the rest of the world. The chart below underscores this disparity. Using traditional metrics like price-to-book ratios, US companies exhibit valuations that are not only excessive but unprecedented in the post-GFC financial era.
It’s almost ironic that some interpret the recent shift in political leadership as a fresh chapter of American exceptionalism, when in reality, we have already experienced an extraordinarily extreme period. While this trend could persist for some time, it is difficult to argue against the notion that it is becoming increasingly long in the tooth. A reallocation of capital from these highly valued assets into those that have been largely ignored seems not only plausible but overdue.
Furthermore, such a shift would align with historical patterns, where extreme concentration of capital in one market tends to precede significant outflows into underappreciated areas. As the valuation of US stocks reaches what we see as excessive levels, the opportunity to identify and capitalize on undervalued markets worldwide becomes an increasingly compelling proposition.
Dangerously Extreme
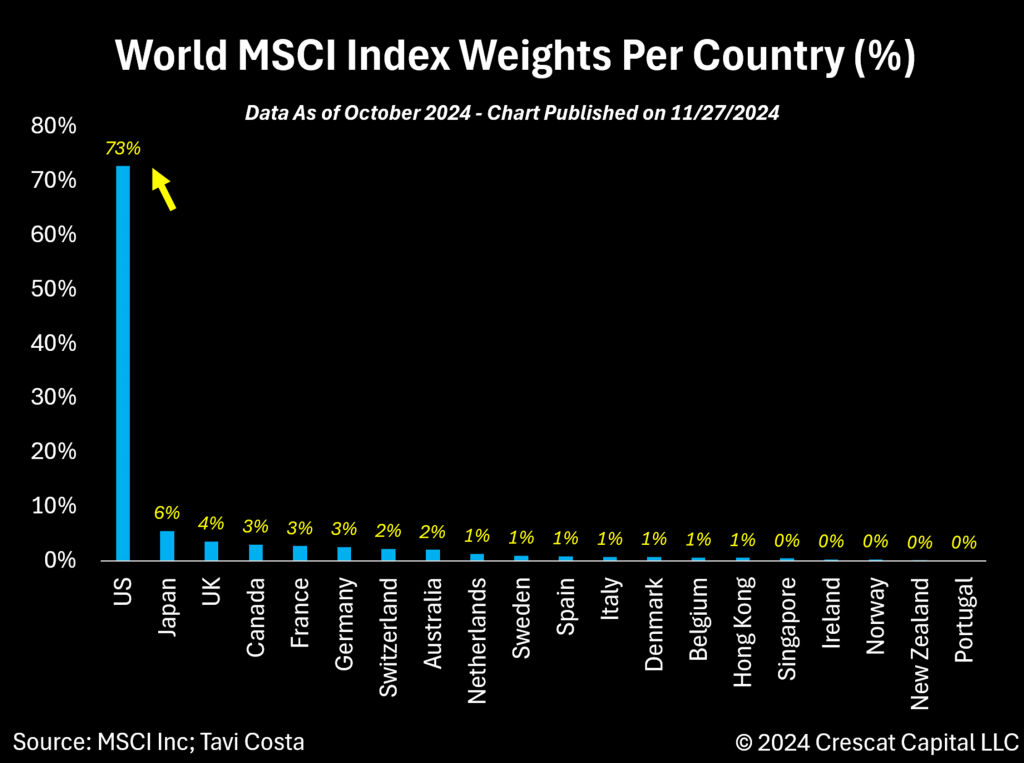
US stocks currently account for 73% of the MSCI World Index, the highest single-country weighting ever recorded in the history of the index.
This overwhelming dominance reflects how US equities have attracted the majority of global capital, leaving the rest of the world largely overlooked and underfunded by investors. At what point does the tide shift? Those who believe it never will blatantly ignore the lessons of history. Market leadership undergoes secular shifts, and after an extended period of US stocks outperforming the rest of the world, it’s increasingly likely that capital will begin to flow back into countries that have long been overlooked.
Trump’s Push for a Weaker Dollar
In an exclusive interview with Bloomberg in July, Trump openly expressed his intent to weaken the dollar as part of his policy agenda. Interestingly, since his election victory, investors appear skeptical. In our view, the same individuals who doubted policymakers could reignite inflation before the excessively loose monetary policies of the COVID crisis are now dismissing Trump’s resolve to drive a weaker US currency.
Trump’s choice for Treasury Secretary, Scott Bessent, represents a significant shift in the policymaking landscape. Bessent is a strong advocate for gold and firmly believes that a major global monetary realignment is imminent. In his interviews, he has echoed Trump’s views, stating that the former president aims to achieve two key objectives: maintaining the US dollar’s reserve currency status and devaluing it relative to other currencies. Bessent has emphasized that these goals are “not mutually exclusive”.
During a conversation on the Capital Allocators podcast, Scott Bessent remarked, “Over my career, some of my best investments have been when a policy, a government, or a management is driving 90 miles an hour toward a brick wall, and you assume they are going to hit the brakes.” We believe his nomination signals precisely this kind of intervention—hitting the brakes before disaster strikes. In our view, his anticipated push to reduce government spending could play a pivotal role in weakening the dollar, especially when combined with a dovish Federal Reserve.
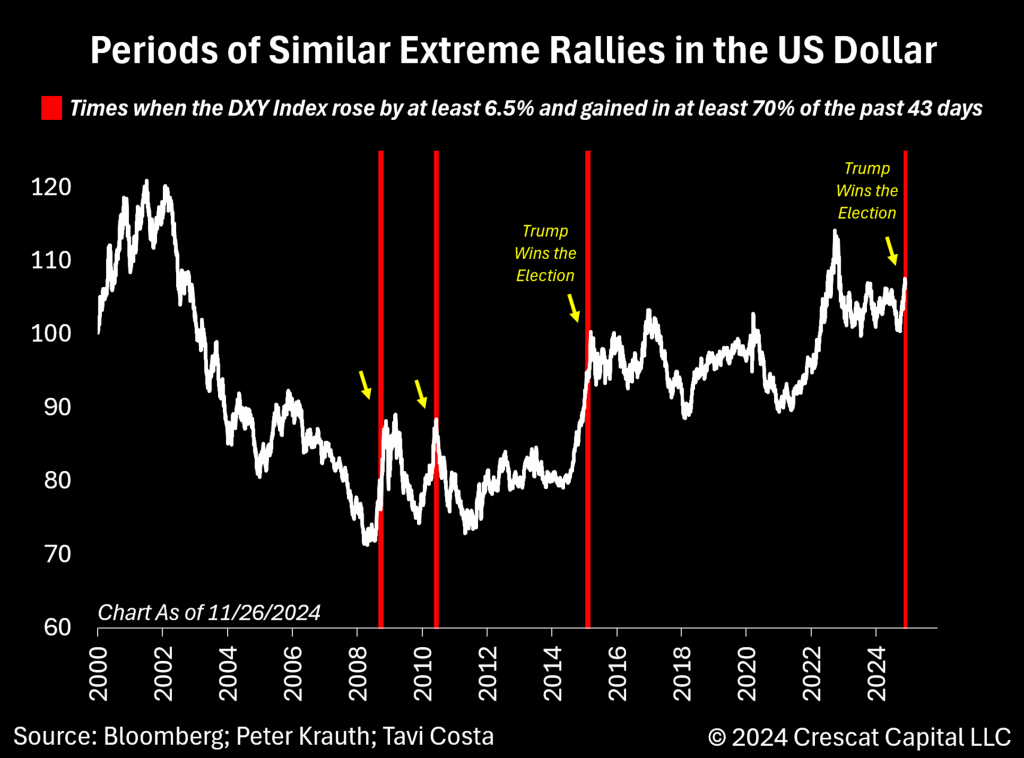
We’ve just seen one of the strongest rallies in the US dollar in decades, starting from its recent bottom on September 27th. The last time we experienced such an extreme spike in USD appreciation was after Trump’s election in 2016. That move quickly reversed the following year, as his policies resulted in a weaker dollar. We think we’re approaching a similar turning point now. This time, however, it is likely to mark the start of a more prolonged trend of dollar depreciation in our view—both against hard assets and other fiat currencies.
The Great Revival of Emerging Markets
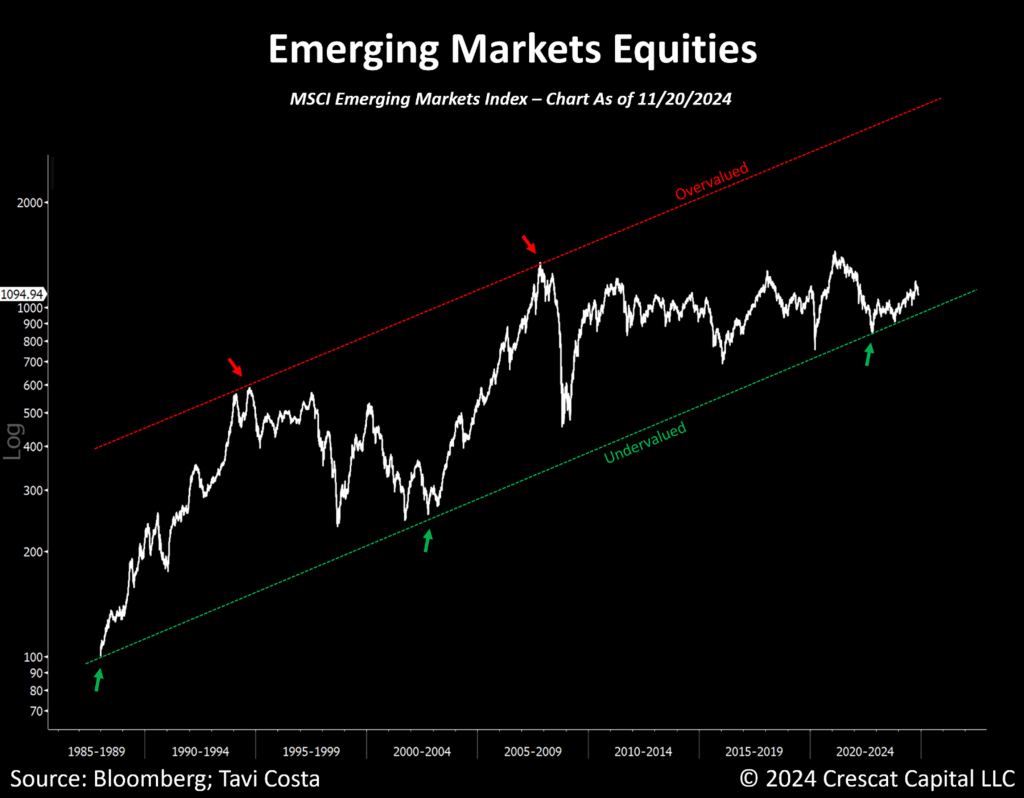
For decades, emerging market equities have traded within a consistent upward channel, with prices closely adhering to long-term upper and lower bands. Currently, this segment of the market sits at the undervalued end of the range. However, it’s worth noting that these equities have essentially moved sideways over the past two decades. We believe this prolonged period of consolidation is poised to shift upward, driven by the potential turning point in the US dollar discussed earlier.
Emerging market companies are not only historically undervalued based on their fundamentals but are also significantly cheaper compared to US stocks. In our view, we are on the brink of a pivotal shift with emerging likely to take the lead over US equities.
Turning the Tide: A Shift from Extreme Underperformance
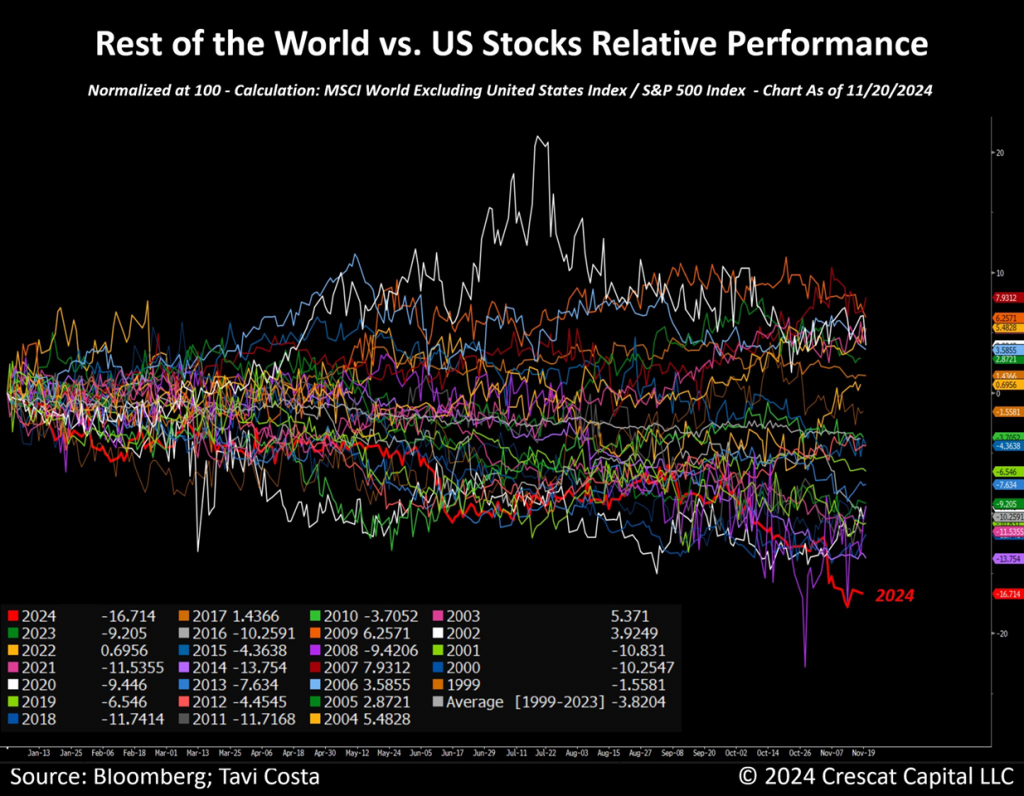
It is not just emerging markets that offer opportunities relative to the US but developed foreign markets too. This year is on pace to be the worst relative performance for all global stock markets versus the US in 25 years.
In our view, a reversal of this trend is long overdue. The potential redistribution of global capital could signal the start of a new phase, where undervalued and overlooked foreign markets of various types (developed and emerging) rise to prominence. Discretion on a country-by-country basis is always warranted, but history shows that US dollar cycle transitions can have a profound impact on investment rebalancing. Investors should be on alert for a change in market dynamics. We believe capital is poised to shift out of crowded, overvalued, overbought sectors with macro headwinds and into under-owned, undervalued, and oversold areas with tailwinds.
Buffett’s Go-To Market Indicator
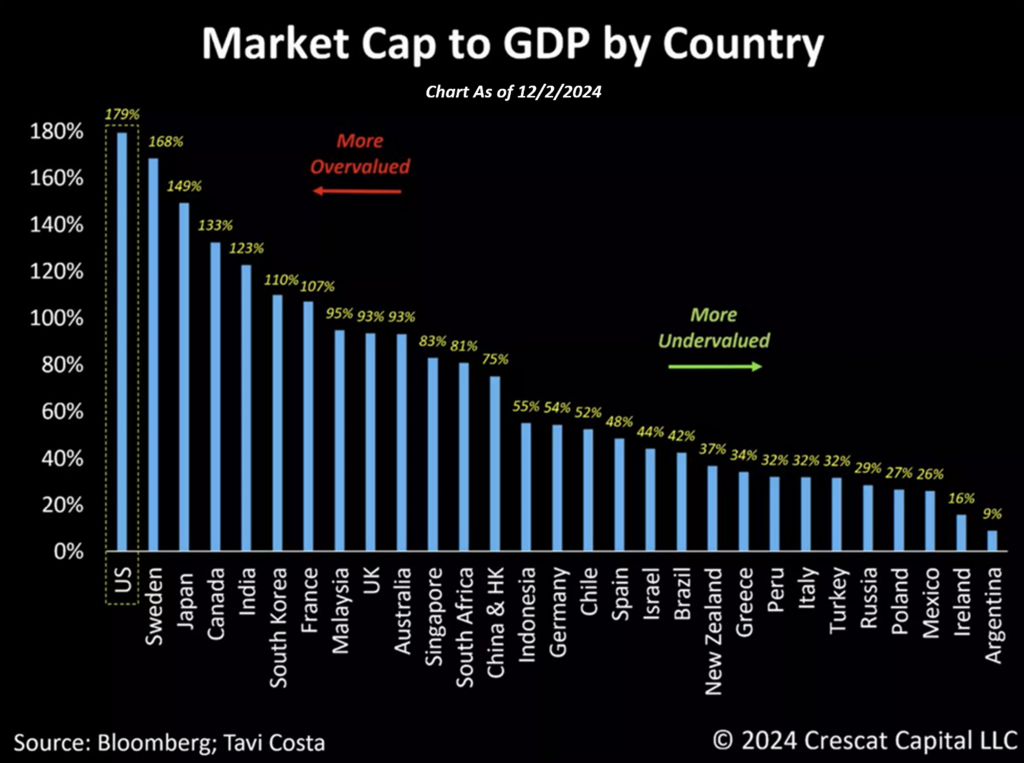
The chart below highlights yet another stark example of the overvaluation issue plaguing U.S. stocks. Utilizing Warren Buffett’s preferred metric for gauging market frothiness, the market cap-to-GDP ratio, it’s evident that the U.S. currently holds the most extreme valuation globally.
Magazine Cover Curse Alert
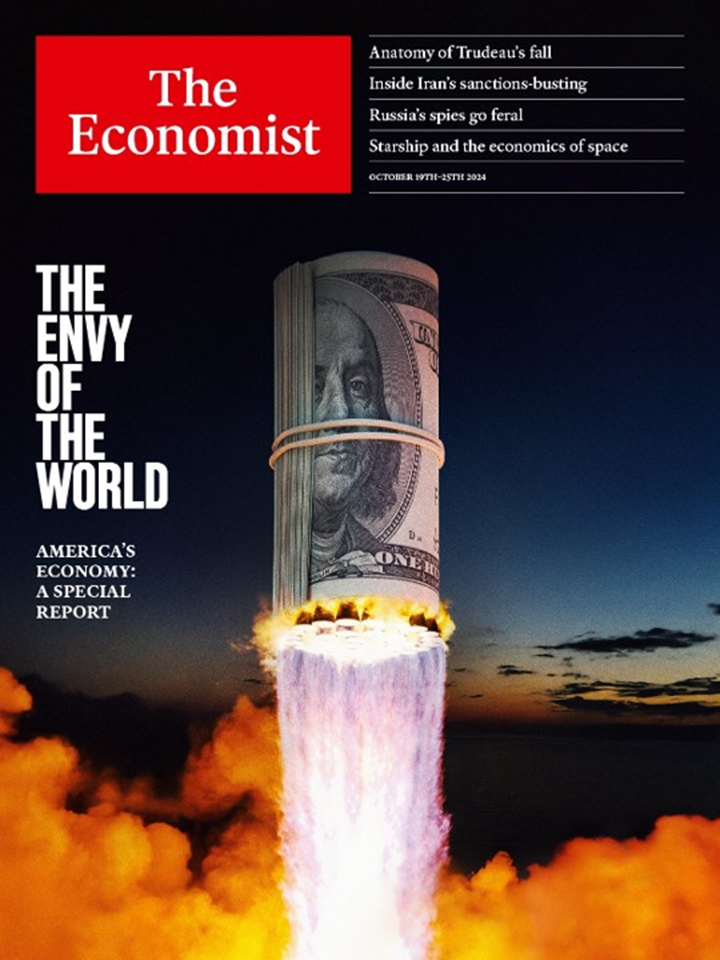
The recent cover of The Economist is a striking reflection of current market sentiment. Investors often have short memories, believing that recent trends will persist indefinitely, creating the illusion of a “new normal.” However, the global economy is cyclical, and market leadership shifts over time.
This cover is reminiscent of its iconic 2009 issue, which depicted Rio de Janeiro’s Christ the Redeemer statue taking off like a rocket, symbolizing Brazil’s anticipated rise to developed economy status. Reality, however, painted a different picture. From that point forward, Brazil entered a challenging period from which it continues to struggle to recover today, 15 years later.
A Leading Indicator for Emerging Markets
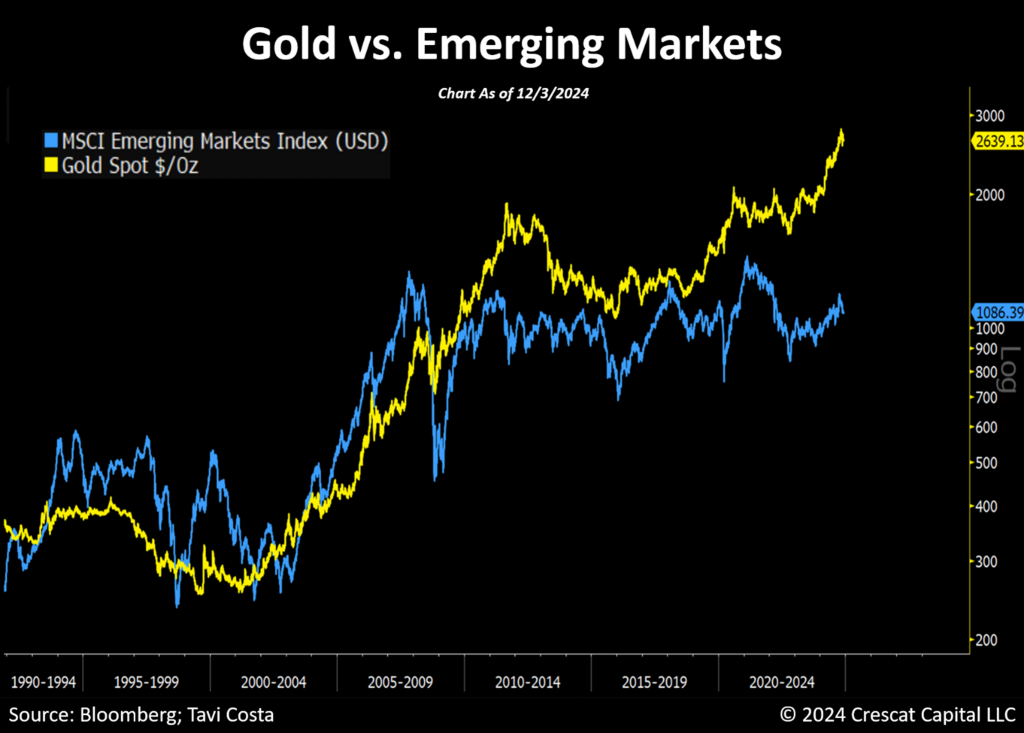
When people often express frustration that, despite rising gold prices, mining company share prices have not benefited, it’s important to note that this phenomenon is not unique to the mining sector. Other asset classes that typically track gold prices closely are also lagging. Does this suggest that gold prices need to decline to catch up, or could emerging markets be poised for a significant rally? We firmly believe that precious metals are entering a new secular bull market, positioning emerging markets, other metals, and mining companies as some of the most asymmetric return-to-risk opportunities in today’s market. Emerging markets have just completed their longest consolidation in the past 40 years, and historically, such periods have been a precursor to explosive upward movements. We believe this time will be no different.
Silver Miners: Turning the Corner
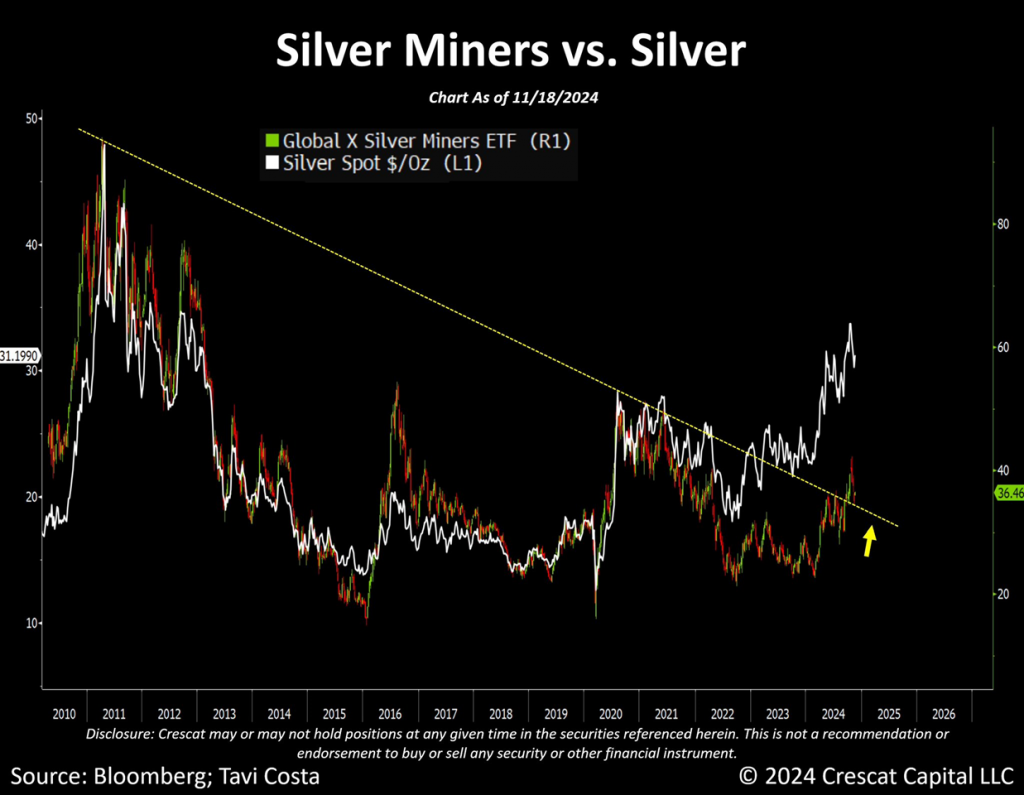
Like the chart above, silver miners also appear exceptionally attractive at their current valuations. We have seen a significant selloff in these stocks since the elections, which we believe is completely unwarranted given the ongoing secular rise in underlying metal prices. The Global X Silver Miners ETF is currently retesting a 13-year resistance line that has now turned into support. Meanwhile, the resilience of silver prices suggests they may be leading the way. There is a big catch-up for silver stocks ahead, in our opinion.
The Golden Cross
The potential for a long-term secular rise in gold remains central to our macro outlook. Since 1970, the metal appears to be entering its third major upward trend in a world where global debt hovers near historic highs, leaving governments and monetary authorities increasingly compelled to accumulate gold at levels unseen in decades. According to the World Gold Council, the past five years have witnessed some of the largest accumulations of gold by central banks in recent history.
From a political standpoint, the discussion about the US potentially building a Bitcoin strategic reserve is intriguing. While it may or may not materialize, we believe it could be masking a much larger strategy. Anyone serious about accumulating a significant amount of an asset would hardly broadcast their intentions beforehand. Logically, that approach makes little sense; any astute capital allocator understands that acting discreetly and disclosing later is a far more strategic move. Similarly, the US, like other economies, has a pressing need to accumulate gold. It wouldn’t surprise us if this becomes part of the Trump administration’s plan.
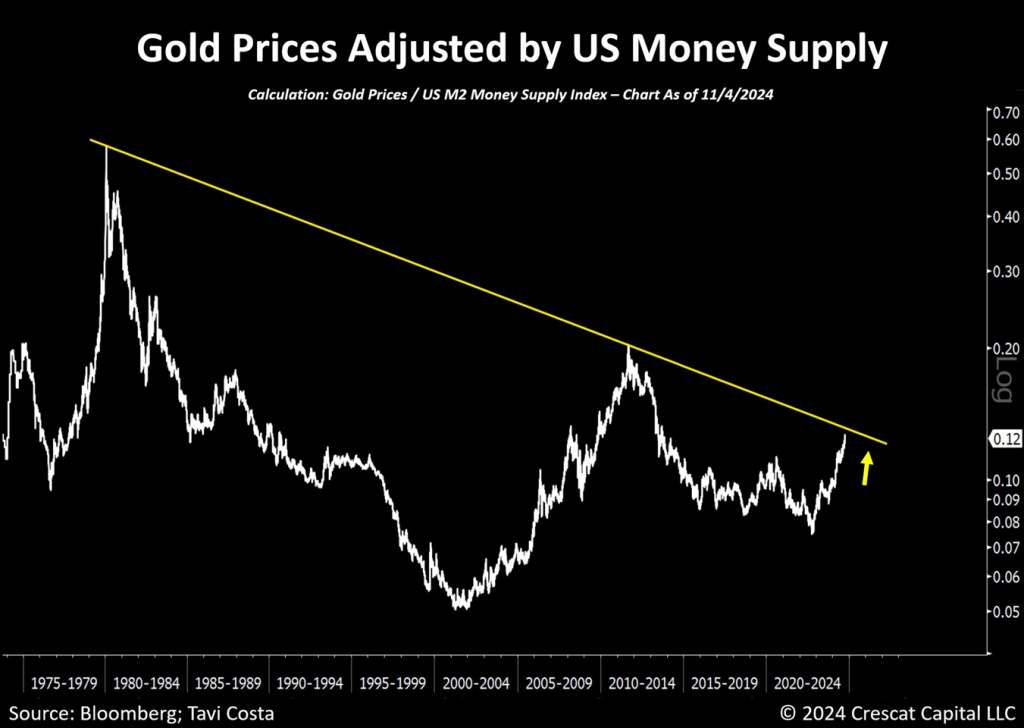
Gold is increasingly becoming the optimal alternative for central banks to improve the quality of their international reserves. Despite being at record prices, here is a reminder that back in 1980, gold reached as high as 70% of central bank assets. Today, it’s below 20%. In our opinion, this creates potential long-term demand for the metal as large monetary authorities are compelled to strengthen their balance sheets amid the ongoing surge in global debt imbalances. If or when the resistance line is crossed in the gold price vs. money supply chart below, it would portend profound new uptrend in gold prices in our opinion.
Mining’s Revival as a Key Industry
This topic deserves an entire letter of its own, but we will just briefly address it here, as we see the mining industry as one of the greatest potential beneficiaries of the current macro environment.
The mining industry, along with the availability of ores and metals, is a fundamental pillar of the U.S. economy. Over time, this once-vital sector has been largely overlooked, with insufficient investment and declining interest contributing to its challenges. However, as the new Trump administration prioritizes deregulation and onshoring efforts and positions itself within the artificial intelligence arms race, alongside a strong focus on reducing dependence on foreign resources, mining could regain its prominence as a cornerstone of these strategic initiatives. Here is a reminder that Trump, during his first term, signed Executive Order 13817 in 2017, which directed agencies to identify critical minerals essential for national security and the economy, and encouraged reducing permitting delays for mining projects involving these minerals.
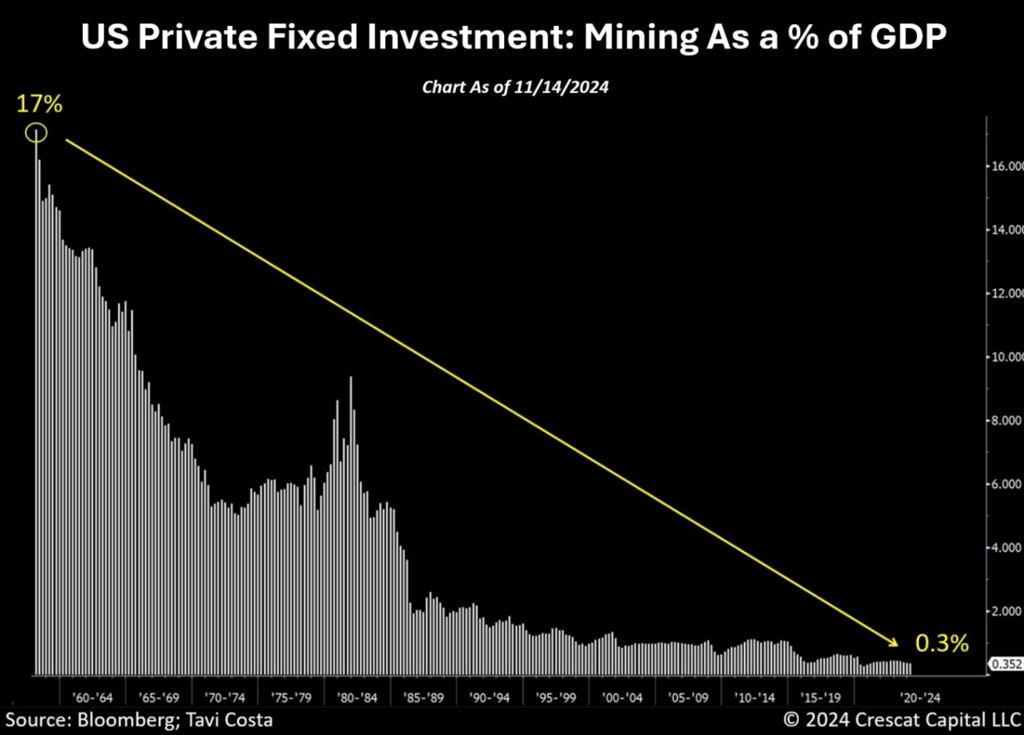
To step back, in 1960, mining contributed nearly 20% to GDP. Today, it accounts for less than 0.5%. While mining operations have become far more efficient and productive, these improvements alone do not explain such a steep decline. The real issue lies in the US economy’s overwhelming reliance on imported ore and metals. With deglobalization trends accelerating, this dependence now poses a growing national risk.
Mining’s importance has arguably never been greater, and policymakers may need to rethink their long-standing negative approach to the industry. This shift could pave the way for a fundamental change in institutional support and a renewed flow of capital into this overlooked sector.
The mining industry has faced a prolonged lack of capital, but the current political emphasis on fostering economic growth to address the debt challenge could provide the spark for its resurgence. As a legacy industry deeply woven into the fabric of society for centuries, we are confident that mining is here to stay. In fact, we would argue that its significance is poised to inflect upward.
Performance
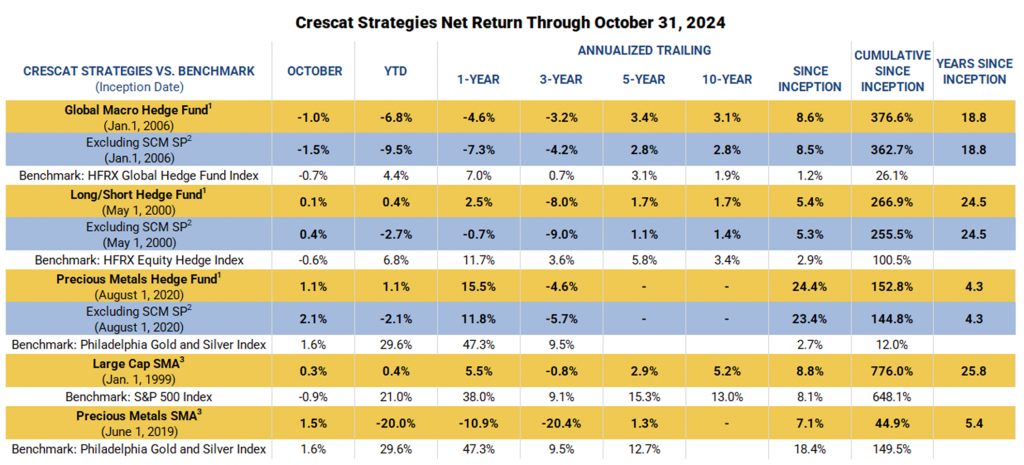
Performance data represents past performance, and past performance does not guarantee future results. Performance data is subject to revision following each monthly reconciliation and/or annual audit. Individual performance may be lower or higher than the performance data presented. The currency used to express performance is U.S. dollars. Before January 1, 2003, the results reflect accounts managed at a predecessor firm. Crescat was not responsible for the management of the assets during the period reflected in those predecessor performance results. We have determined the management of these accounts was sufficiently similar and provides relevant performance information. See additional performance disclosures below. 1,2, and 3 Footnote references are listed in the disclosures below.
We encourage you to reach out to any of us listed below if you would like to learn more about how our investment vehicles might fit with your individual needs and objectives.
Sincerely,
Kevin C. Smith, CFA
Founding Member & Chief Investment Officer
Tavi Costa
Member & Macro Strategist
Quinton T. Hennigh, PhD
Member & Geologic and Technical Director
For more information including how to invest, please contact:
Marek Iwahashi
Head of Investor Relations
miwahashi@crescat.net
(720) 323-2995
Linda Carleu Smith, CPA
Co-Founding Member & Chief Operating Officer
lsmith@crescat.net
(303) 228-7371
© 2024 Crescat Capital LLC
Important Disclosures
The purpose of this letter is to provide access to analyses prepared by Crescat Portfolio Management LLC (“CPM”) with respect to certain companies (“Issuers”) in which CPM and certain of the Funds and accounts it manages are shareholders. The letters enable CPM to share macro themes and newsworthy geologic updates, good and bad, across our Issuers as they arise. The letters represent the opinions of CPM, as an exploration industry advocate, on the overall geologic progress of our activist strategy in creating new economic metal deposits in viable mining jurisdictions around the world. Each issuer discussed has been selected solely for this purpose and has not been selected on the basis of performance or any performance-related criteria. The securities discussed herein do not represent an entire portfolio and in the aggregate may only represent a small percentage of a strategy’s holdings. The Issuers discussed may or may not be held in such portfolios at any given time. The Issuers discussed do not represent all of the investments purchased or sold by Funds managed by CPM. It should not be assumed that any or all of these investments were or will be profitable. Investments in Issuers discussed may not be appropriate for all investors. Actual holdings will vary for each client or fund and there is no guarantee that a particular account will hold any or all of the securities discussed.
Projected results and statements contained in this letter that are not historical facts are based on current expectations and involve risks, uncertainties and other factors that may cause actual results, performance or achievements to be materially different from any future results.
This letter may contain certain forward-looking statements, opinions and projections that are based on the assumptions and judgments of Crescat with respect to, among other things, future economic, competitive and market conditions and future business decisions, all of which are difficult or impossible to predict accurately and many of which are beyond the control of Crescat. Because of the significant uncertainties inherent in these assumptions and judgments, you should not place undue reliance on these forward looking statements, nor should you regard the inclusion of these statements as a representation by Crescat that these objectives will be achieved. These opinions are current as of the date stated and are subject to change without notice. The information contained in the letter is based on publicly available information with respect to the Issuers as of the date of such letter and will not be updated after such date.
Discussion and details provided is for informational purposes only. This letter is not intended to be, nor should it be construed as, an offer to sell or a solicitation of an offer to buy any security, services of Crescat, or its Funds. The information provided in this letter is not intended as investment advice or recommendation to buy or sell any type of investment, or as an opinion on, or a suggestion of, the merits of any particular investment strategy.
This letter is not intended to be, nor should it be construed as, a marketing or solicitation vehicle for CPM or its Funds. The information herein does not provide a complete presentation of the investment strategies or portfolio holdings of the Funds and should not be relied upon for purposes of making an investment or divestment decision with respect to the Funds. Those who are considering an investment in the Funds should carefully review the relevant Fund’s offering memorandum and the information concerning CPM.
This presentation should not be construed as legal, tax, investment, financial or other advice. It does not have regard to the specific investment objective, financial situation, suitability, or the particular need of any specific person who may receive this presentation and should not be taken as advice on the merits of any investment decision. The views expressed in this presentation represent the opinions of CPM and are based on publicly available information with respect to the Issuer. Crescat recognizes that the Issuer may disagree with Crescat’s conclusions.
CPM currently beneficially owns, and/or has an economic interest in, shares of the Issuers discussed in these letters. Therefore, CPM’s clients, principals and employees may stand to realize significant gains or losses if the price of the companies’ securities move. After the publication or posting of any material, CPM, its principals and employees will continue transacting in the securities discussed, and may be long, short or neutral at any time thereafter regardless of their initial position or recommendation. While certain individuals affiliated with CPM are current or former directors of certain of the Issuers referred to herein, none of the information contained in this presentation or otherwise provided to you is derived from non-public information of such publicly traded companies. CPM has not sought or obtained consent from any third party to use any statements or information indicated herein that have been obtained or derived from statements made or published by such third parties.
All content posted on CPM’s letters including graphics, logos, articles, and other materials, is the property of CPM or others and is protected by copyright and other laws. All trademarks and logos are the property of their respective owners, who may or may not be affiliated with CPM. Nothing contained on CPM’s website or social media networks should be construed as granting, by implication, estoppel, or otherwise, any license or right to use any content or trademark displayed on any site without the written permission of CPM or such other third party that may own the content or trademark displayed on any site.
Performance
Performance data represents past performance, and past performance does not guarantee future results. Performance data is subject to revision following each monthly reconciliation and/or annual audit. Individual performance may be lower or higher than the performance data presented. The currency used to express performance is U.S. dollars. Before January 1, 2003, the results reflect accounts managed at a predecessor firm. Crescat was not responsible for the management of the assets during the period reflected in those predecessor performance results. We have determined the management of these accounts was sufficiently similar and provides relevant performance information.
1 – Net returns reflect the performance of an investor who invested from inception and is eligible to participate in new issues and side pocket investments. Net returns reflect the reinvestment of dividends and earnings and the deduction of all expenses and fees (including the highest management fee and incentive allocation charged, where applicable). An actual client’s results may vary due to the timing of capital transactions, high watermarks, and performance.
2 – Performance figures presented Excluding SCM SP represent the fund’s net returns calculated without the impact of the San Cristobal Mining, Inc. side pocket that was designated on July 1st, 2024. The side pocket includes a private equity asset that is not available to new investors in the funds on or after July 1, 2024. Excluding these assets provides a clearer view of the performance to investors coming into the funds after that date. New investors cannot participate in the SCM Side Pocket and will not share in its potential gains or losses. Investors should consider both the overall performance and the performance excluding the side pocket when evaluating the fund’s returns.
3 – The SMA composites include all accounts that are managed according to CPM’s precious metals or large cap SMA strategy over which it has full discretion. Investment results shown are for taxable and tax-exempt accounts. Any possible tax liabilities incurred by the taxable accounts are not reflected in net performance. Performance results are time weighted and reflect the deduction of advisory fees, brokerage commissions, and other expenses that a client would have paid, and includes the reinvestment of dividends and other earnings.
Risks of Investment Securities: Diversity in holdings is an important aspect of risk management, and CPM works to maintain a variety of themes and equity types to capitalize on trends and abate risk. CPM invests in a wide range of securities depending on its strategies, as described above, including but not limited to long equities, short equities, mutual funds, ETFs, commodities, commodity futures contracts, currency futures contracts, fixed income futures contracts, private placements, precious metals, and options on equities, bonds and futures contracts. The investment portfolios advised or sub-advised by CPM are not guaranteed by any agency or program of the U.S. or any foreign government or by any other person or entity. The types of securities CPM buys and sells for clients could lose money over any timeframe. CPM’s investment strategies are intended primarily for long-term investors who hold their investments for substantial periods of time. Prospective clients and investors should consider their investment goals, time horizon, and risk tolerance before investing in CPM’s strategies and should not rely on CPM’s strategies as a complete investment program for all of their investable assets. Of note, in cases where CPM pursues an activist investment strategy by way of control or ownership, there may be additional restrictions on resale including, for example, volume limitations on shares sold. When CPM’s private investment funds or SMA strategies invest in the precious metals mining industry, there are particular risks related to changes in the price of gold, silver and platinum group metals. In addition, changing inflation expectations, currency fluctuations, speculation, and industrial, government and global consumer demand; disruptions in the supply chain; rising product and regulatory compliance costs; adverse effects from government and environmental regulation; world events and economic conditions; market, economic and political risks of the countries where precious metals companies are located or do business; thin capitalization and limited product lines, markets, financial resources or personnel; and the possible illiquidity of certain of the securities; each may adversely affect companies engaged in precious metals mining related businesses. Depending on market conditions, precious metals mining companies may dramatically outperform or underperform more traditional equity investments. In addition, as many of CPM’s positions in the precious metals mining industry are made through offshore private placements in reliance on exemption from SEC registration, there may be U.S. and foreign resale restrictions applicable to such securities, including but not limited to, minimum holding periods, which can result in discounts being applied to the valuation of such securities. In addition, the fair value of CPM’s positions in private placements cannot always be determined using readily observable inputs such as market prices, and therefore may require the use of unobservable inputs which can pose unique valuation risks. Furthermore, CPM’s private investment funds and SMA strategies may invest in stocks of companies with smaller market capitalizations. Small- and medium-capitalization companies may be of a less seasoned nature or have securities that may be traded in the over-the-counter market. These “secondary” securities often involve significantly greater risks than the securities of larger, better-known companies. In addition to being subject to the general market risk that stock prices may decline over short or even extended periods, such companies may not be well-known to the investing public, may not have significant institutional ownership and may have cyclical, static or only moderate growth prospects. Additionally, stocks of such companies may be more volatile in price and have lower trading volumes than larger capitalized companies, which results in greater sensitivity of the market price to individual transactions. CPM has broad discretion to alter any of the SMA or private investment fund’s investment strategies without prior approval by, or notice to, CPM clients or fund investors, provided such changes are not material.
Benchmarks
PHILADELPHIA STOCK EXCHANGE GOLD AND SILVER INDEX. The Philadelphia Stock Exchange Gold and Silver Index is the longest running index of global precious metals mining stocks. It is a diversified, capitalization-weighted index of the leading companies involved in gold and silver mining. It is a suitable benchmark for the Crescat Precious Metals private fund and the Crescat Precious Metals SMA strategy, which have also been predominately composed of precious metals mining companies involved in gold and silver mining since inception.
S&P 500 INDEX. The S&P 500 Index is perhaps the most followed stock market index. It is considered representative of the U.S. stock market at large. It is a market cap-weighted index of the 500 largest and most liquid companies listed on the NYSE and NASDAQ exchanges. While the companies are U.S. based, most of them have broad global operations. Therefore, the index is representative of the broad global economy. It is a suitable benchmark for the Crescat Global Macro and Crescat Long/Short private funds, and the Large Cap and Precious Metals SMA strategies, which have also traded extensively in large, highly liquid global equities through U.S.-listed securities, and in companies Crescat believes are on track to achieve that status. The S&P 500 Index is also used as a supplemental benchmark for the Crescat Precious Metals private fund and Precious Metals SMA strategy because one of the long-term goals of the precious metals strategy is low correlation to the S&P 500.
Standard and Poor’s 500 Metals & Mining Index is a capitalization-weighted index. The index was developed with a base level of 10 for the 1941-43 base period. The parent index is SPXL3. This is a GICS Level 3 Industries. Intraday values are calculated by Bloomberg and not supported by S&P DJI, however the close price in HP<GO> is the official close price calculated by S&P DJI.
The Consumer Price Index (CPI) is a measure of the average change over time in the prices paid by urban consumers for a market basket of consumer goods and services.
Global Money Supply is the total amount of monetary assets available in the economy at a given time. This index measures the entire stock of currency and other liquid instruments in circulation in an economy at a specific point in time. It includes cash in circulation (physical currency), bank deposits that can be easily converted to cash, other liquid assets, depending on the specific measure used. This index calculates the aggregate money supply across the entire global economy measured by Bloomberg.
References to indices, benchmarks or other measures of relative market performance over a specified period of time are provided for your information only. Reference to an index does not imply that the fund or separately managed account will achieve returns, volatility or other results similar to that index. The composition of an index may not reflect the manner in which a portfolio is constructed in relation to expected or achieved returns, portfolio guidelines, restrictions, sectors, correlations, concentrations, volatility or tracking.
Separately Managed Account (SMA) disclosures: The Crescat Large Cap Composite and Crescat Precious Metals Composite include all accounts that are managed according to those respective strategies over which the manager has full discretion. SMA composite performance results are time-weighted net of all investment management fees and trading costs including commissions and non-recoverable withholding taxes. Investment management fees are described in CPM’s Form ADV 2A. The manager for the Crescat Large Cap strategy invests predominantly in equities of the top 1,000 U.S. listed stocks weighted by market capitalization. The manager for the Crescat Precious Metals strategy invests predominantly in a global all-cap universe of precious metals mining stocks.
Hedge Fund disclosures: Only accredited investors and qualified clients will be admitted as limited partners to a CPM hedge fund. For natural persons, investors must meet SEC requirements including minimum annual income or net worth thresholds. CPM’s hedge funds are being offered in reliance on an exemption from the registration requirements of the Securities Act of 1933 and are not required to comply with specific disclosure requirements that apply to registration under the Securities Act. The SEC has not passed upon the merits of or given its approval to CPM’s hedge funds, the terms of the offering, or the accuracy or completeness of any offering materials. A registration statement has not been filed for any CPM hedge fund with the SEC. Limited partner interests in the CPM hedge funds are subject to legal restrictions on transfer and resale. Investors should not assume they will be able to resell their securities. Investing in securities involves risk. Investors should be able to bear the loss of their investment. Investments in CPM’s hedge funds are not subject to the protections of the Investment Company Act of 1940.
Investors may obtain the most current performance data, private offering memoranda for CPM’s hedge funds, and information on CPM’s SMA strategies, including Form ADV Part 2 and 3, by contacting Linda Smith at (303) 271-9997 or by sending a request via email to lsmith@crescat.net. See the private offering memorandum for each CPM hedge fund for complete information and risk factors.
Additional disclosures including the firms ADV’s can be found here: https://www.crescat.net/due-diligence/disclosures/