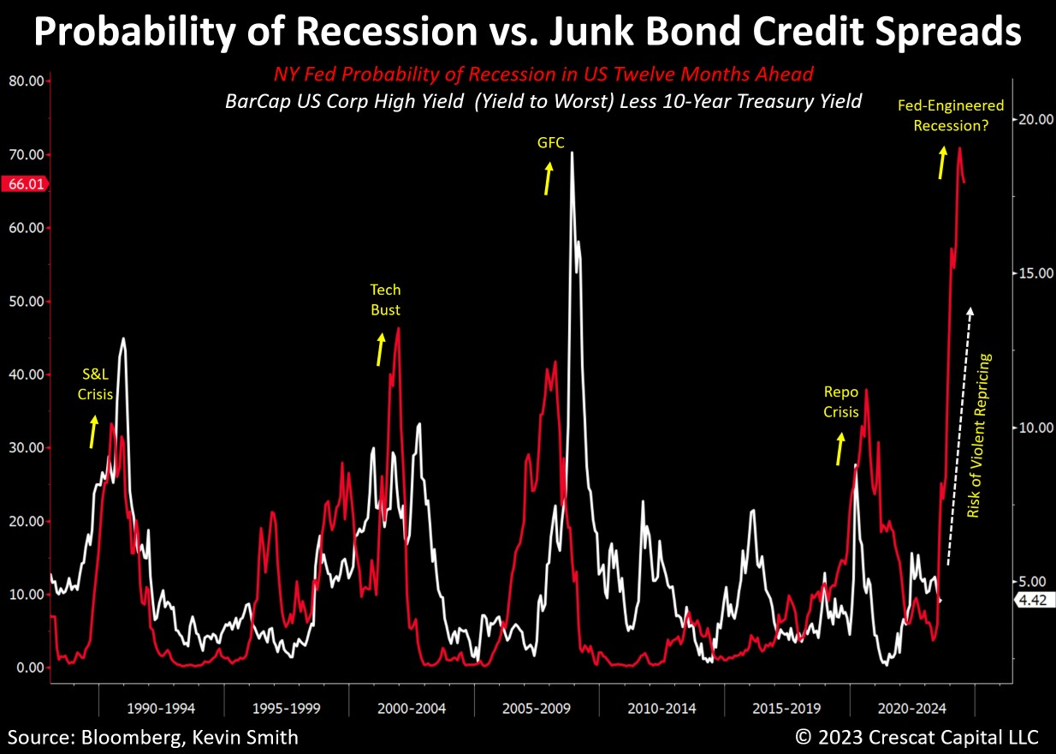
There is a high probability of a recession in the next twelve months according to the NY Fed’s statistically significant yield-curve inversion model. One wouldn’t know it by looking at risk premia across equity and credit markets. Sub-investment-grade corporate bonds are just one area where there is a glaring imbalance. As one can see in our model below, in the entire history of the junk bond market, a contraction in the real economy has been synonymous with a blowout in high-yield credit spreads. Indeed, that is what this model is forecasting over the next year.
Junk credit spreads look highly vulnerable to “violent repricing”, a term that Stanford PhD economist and investment manager John Hussman recently used on X/Twitter to describe the path to his 60%+ downside target for S&P 500 based on similar risk imbalances in the equity markets.
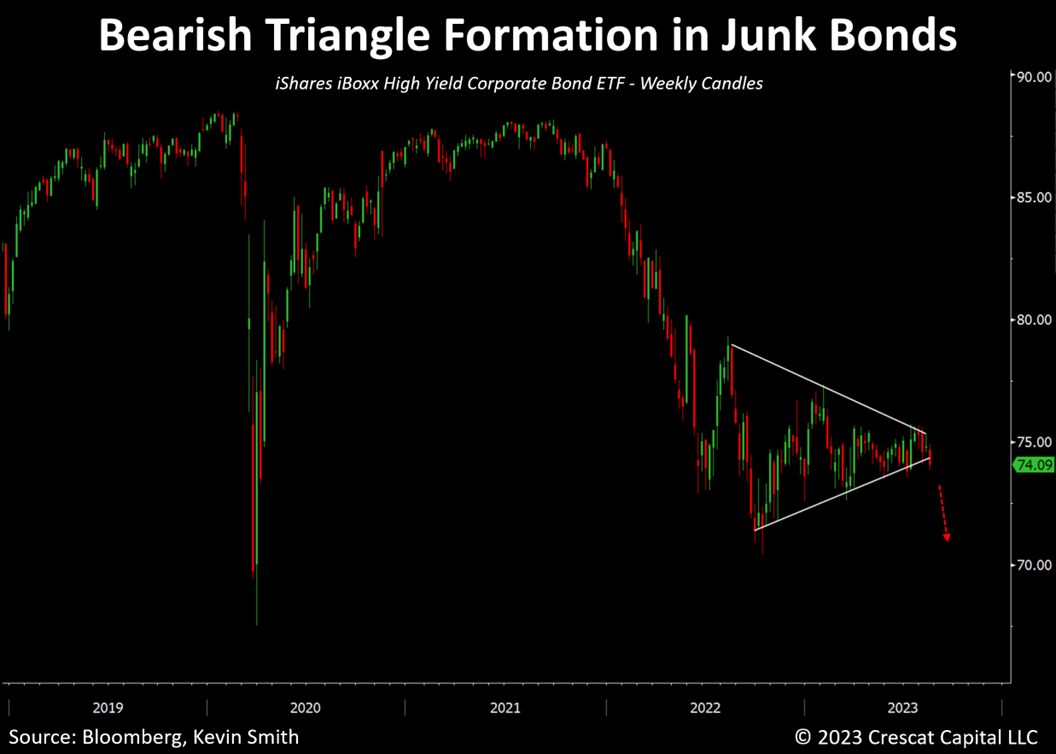
Technically speaking, junk bonds look ripe for a near-term breakdown out of a bearish triangle formation. The 10-year Treasury yield just breached its highest levels in sixteen years, since pre-GFC, and is a potential catalyst.
We would note that the private equity industry is highly dependent on junk bond debt financing for its equity deals. Implied risk premia among private equity fund sponsor stocks, as measured by tangible common equity to market cap are historically tight while leverage is high. At the same time, industry portfolio valuation policies are coming under scrutiny, there is significant exposure to distressed commercial real estate, and client net inflows are under pressure. We see downside risk to their lofty stock prices.
A Warning in the FOMC Minutes
As far as the Fed’s more comprehensive outlook for a near-term recession, in its latest FOMC minutes last week, it summarized that the risks to its baseline projections for real growth and inflation are currently skewed in three directions:
- Real economic growth comes in less than projected.
- Inflation comes in higher than projected due to persistent factors including potentially adverse supply shocks; and
- Additional tightening is “required” due to the second risk which would cause even further downside to its projections for real GDP.
We believe what the Fed just gave us is the roadmap for a coming stagflationary recession. No one can say that they did not give the world full disclosure and fair warning.
When it comes to hiking the US economy into a recession, the Fed is a serial killer. It is a tough job, but the central bank must do it. Soft landings are rare because the concept of taking the punch bowl away early sounds good in theory but is nearly impossible in practice. Inflationary forces inevitably build from too-easy monetary and fiscal policies, and ultimately the Fed is left with no other choice. Such is the business cycle. But even with strong recessionary signals like a massively inverted yield curve, investor animal spirits driven by backward-looking FOMO and MOMO will often rage like they are today provoking the Fed even more to crush foolish dreams by turning the screws of monetary tightening one more time.
Megacap Tech Wreck in the Making
The double-top formation in the NYSE FANG+ index is a bearish technical sign. The historically tight risk premia (low earnings yield relative to Treasuries) for this group of former megacap winners combined with the Fed tightening is the bigger fundamental and macro setup. The trailing aggregate P/E for these ten megacap companies is a historically high 45 times. In this case, analysts’ highly questionable year-ahead earnings growth projections of 55% are contributing to the likely mispricing. We see these estimates as ludicrous aspirational targets fueled by “AI” euphoria.
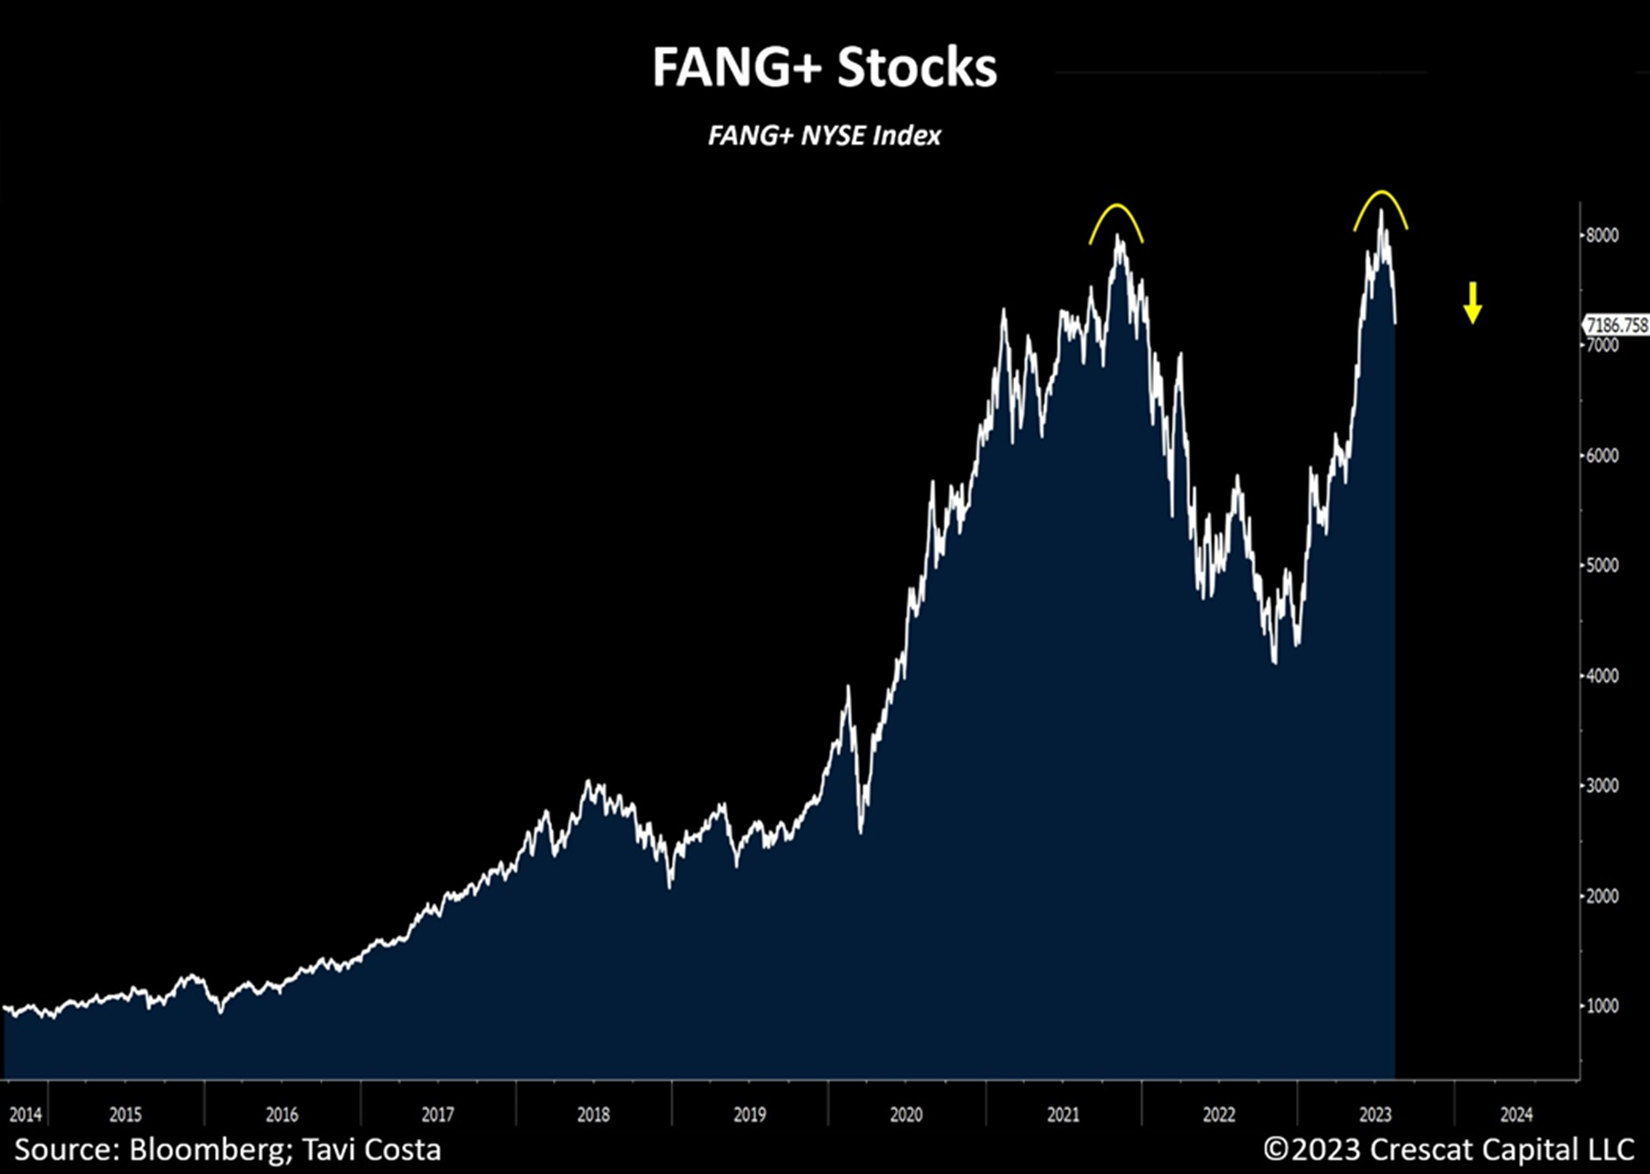
How could the earnings of ten of the world’s biggest technology-oriented companies be immune from a highly probable recession? In our analysis, these companies’ combined earnings twelve months out are doomed to disappoint badly while their stock prices should become the subject of a violent repricing. For the roadmap, refer to the performance of large-cap tech stocks during the 2001 recession in the wake of the Internet bubble.
Tech Stocks vs. 10-year Treasuries
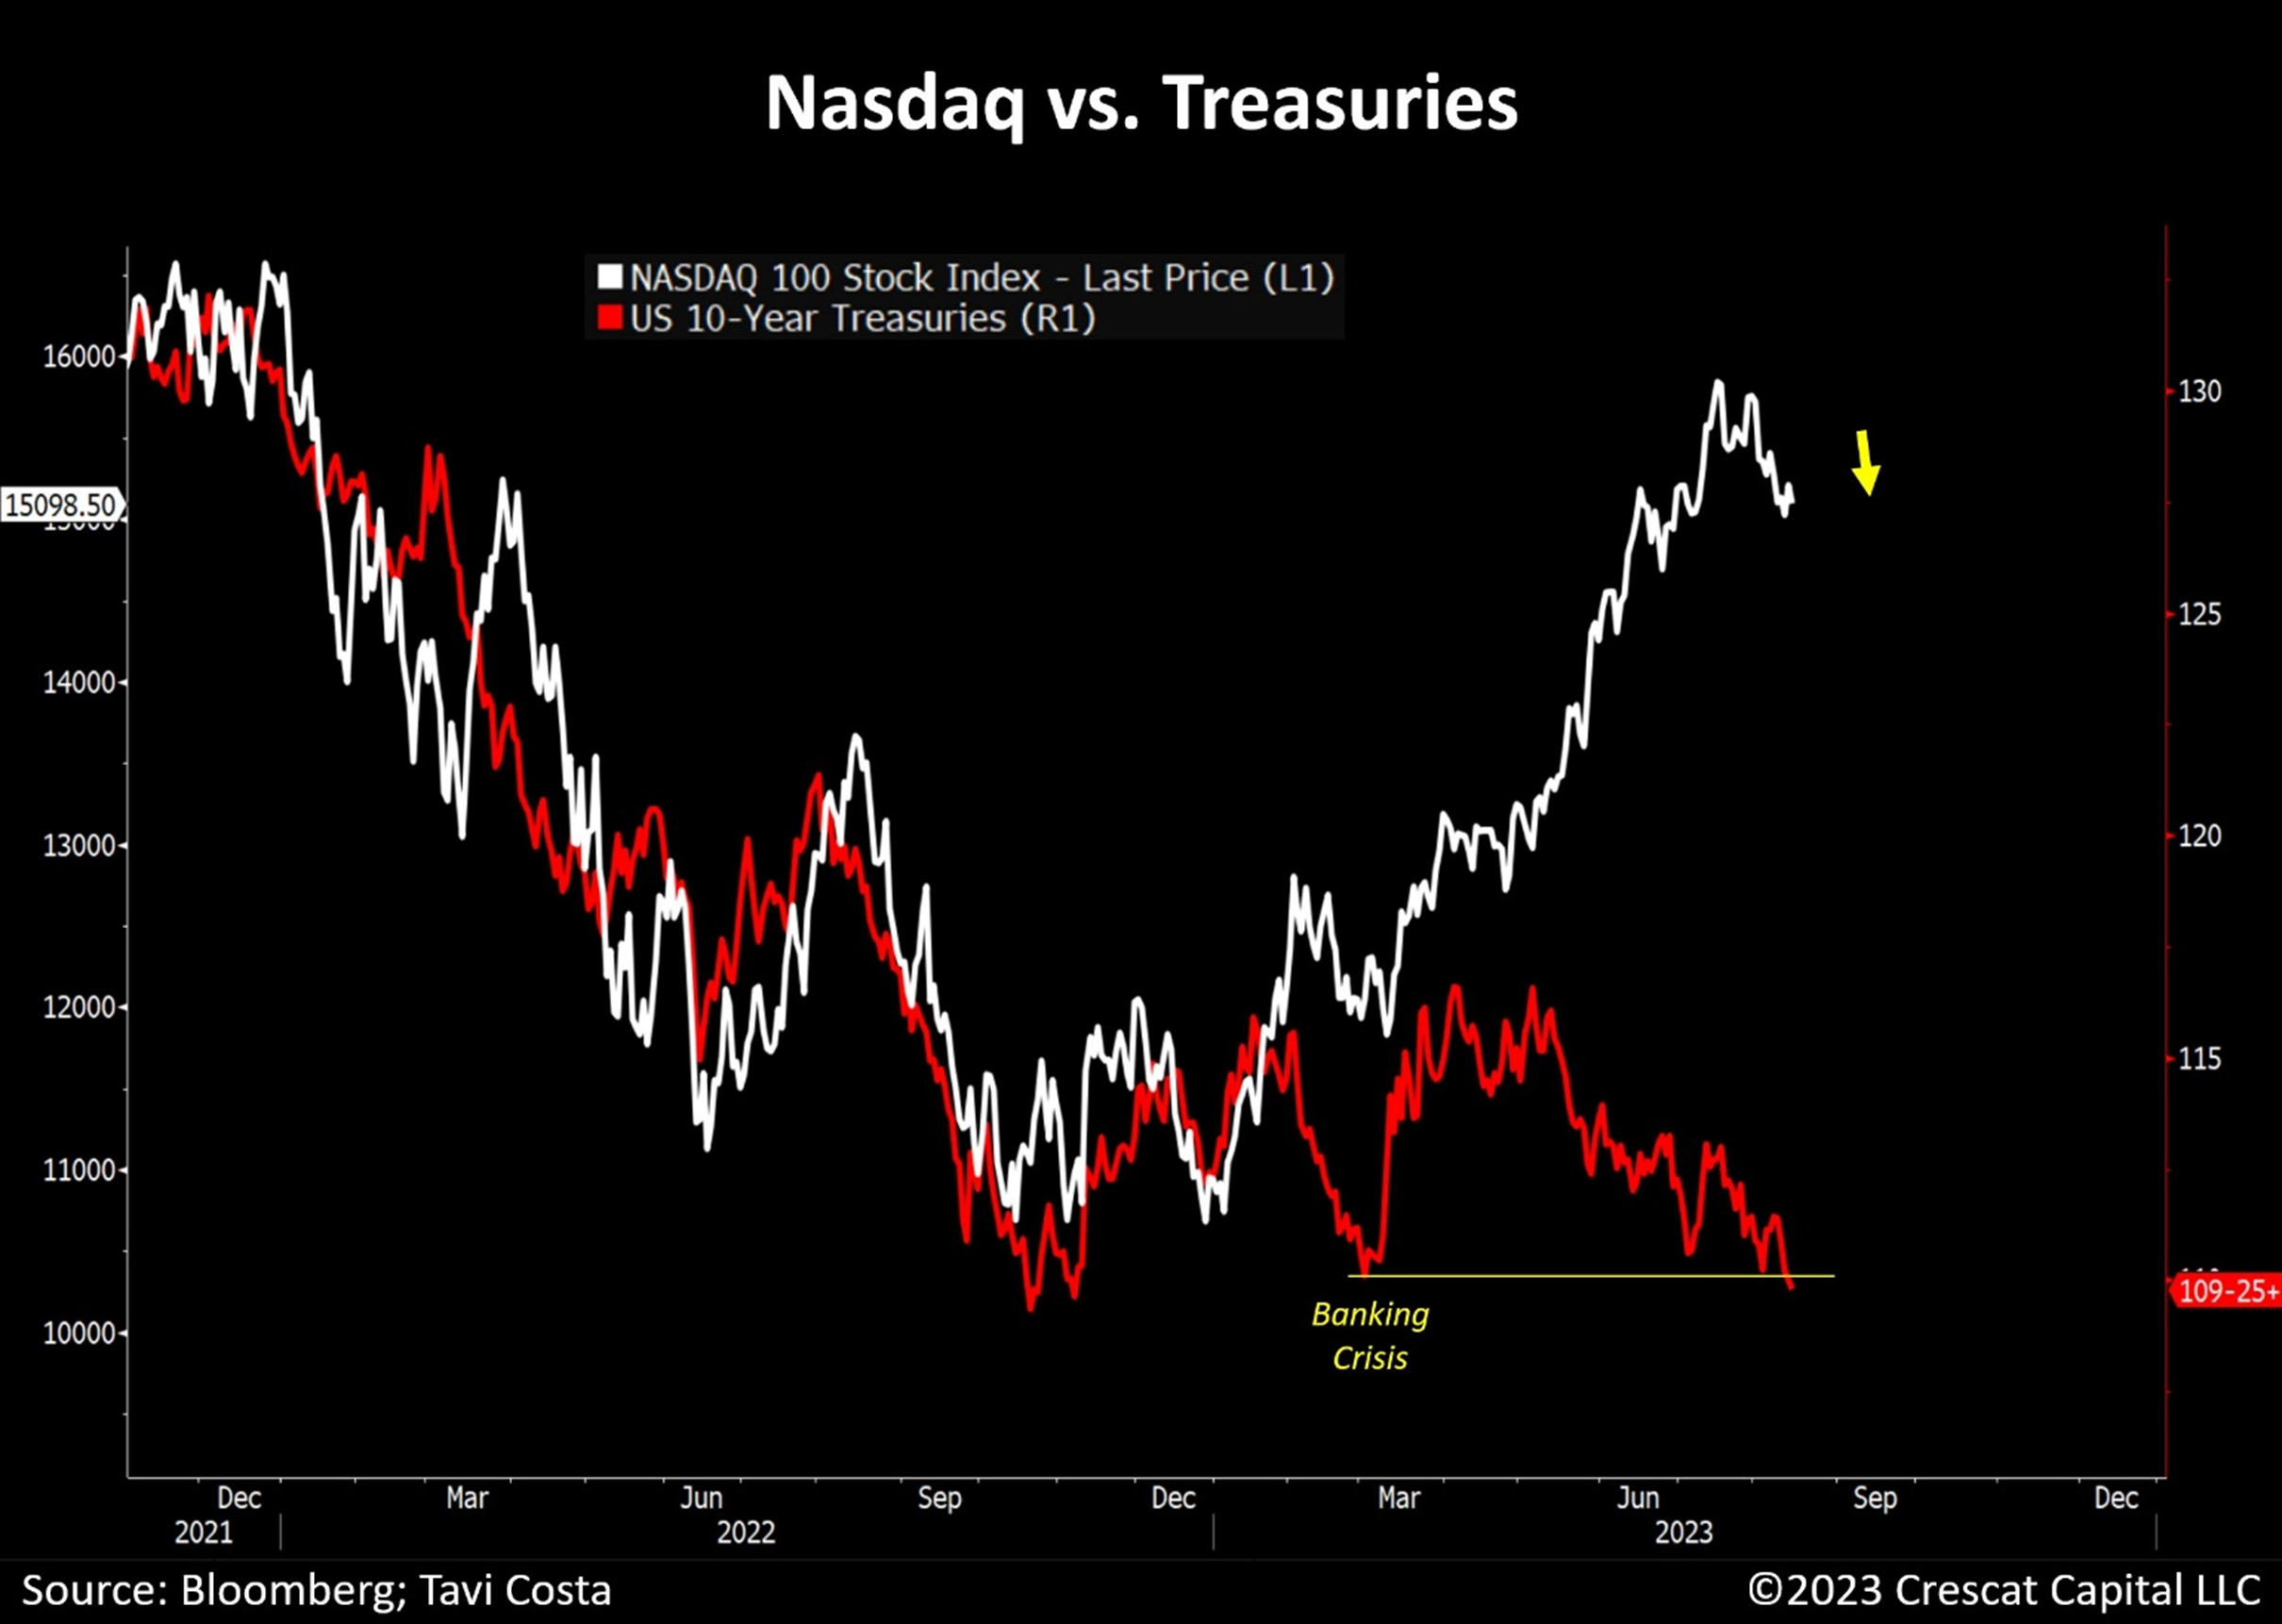
10-year Treasury prices just broke down below the levels that triggered the bank runs earlier this year. Maintaining high earnings multiples for financial assets requires a low discount rate which is also known as the “cost of capital”. For stocks, there are three components to estimating this rate for purposes of a discounted cash flow valuation model. The risk-free rate, which is often assumed to be the 10-year Treasury yield, is just one of the building blocks. But Treasury yields alone are not the discount rate for risky assets. A risk premium to Treasuries needs to be applied. There are risk premiums for general equity market risk and for stock-specific risk. The recent increase in the risk-free rate alone should be driving valuations for popular tech stocks lower, as it did in 2022. This relationship can be seen in the chart below, but there has been a major speculative divergence in 2023, one that is destined to be reconciled in our view, potentially very soon.
Hidden Losses at Banks
It was not just a liquidity problem but a solvency problem that triggered the bank runs and failures earlier this year. The banking system at large is solvent but has taken a hit. There are several banks, however, that still have a potential solvency problem in our analysis. We think this risk is underappreciated. Additional capital has been raised at these troubled banks to protect depositors, but the problem not appreciated is that it has only made the common equity shareholders of these firms more likely to suffer. We think investors at large still do not get it, though the rating agencies at least have started to wake up.
Let us try to explain. On average from 1996 to 2020, US banks’ Held-to-Maturity (HTM) securities accounted for about 3% of their total assets of US, whereas Available-for-Sale (AFS) securities accounted for 16%. In late 2020, we begin to see a divergence from their nearly 25-year-long relationship. Banks start classifying more securities as HTM. Then starting in early to mid-2022, when the Federal Reserve began its interest rate hiking cycle, banks began classifying fewer securities as AFS while continuing to increase their HTM holdings.
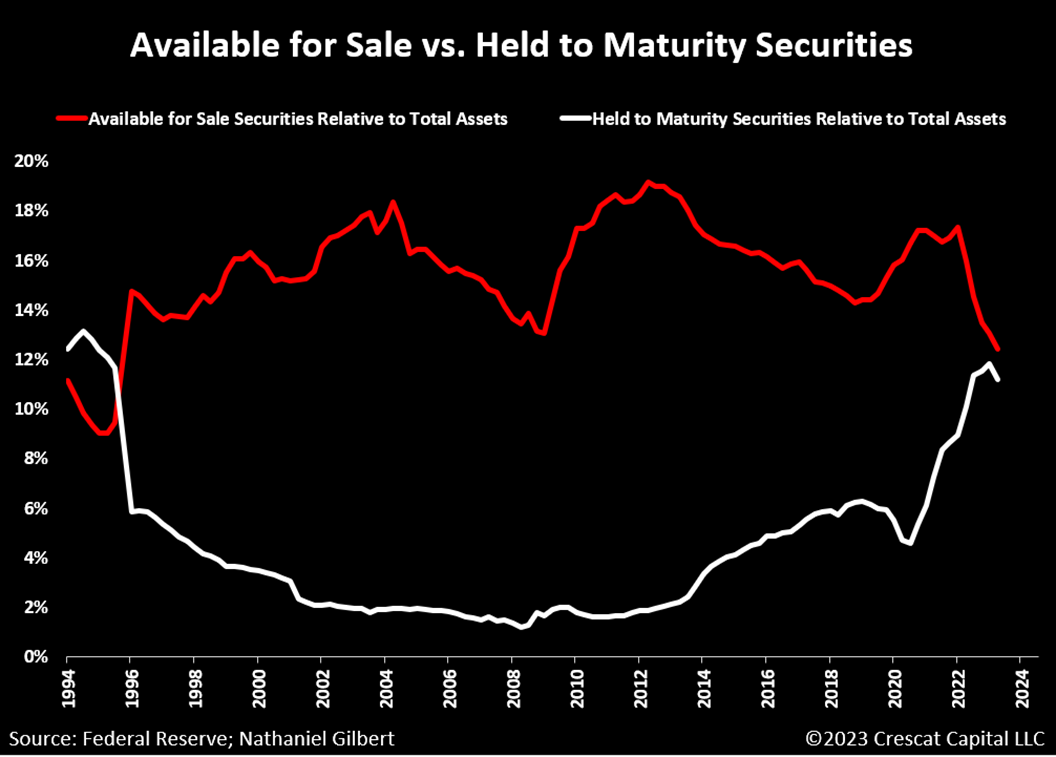
By swapping out AFS holdings for HTM ones, banks pulled the wool over investors’ eyes by avoiding having to mark to market their rapidly depreciating long-duration Treasury portfolios hit by rising interest rates.
On March 10, 2023, the wool was partially lifted when Silicon Valley Bank failed. SVB’s liquidity issues revealed an underlying solvency issue, a massive hidden loss on its HTM securities that when adjusted for fair value, would bring its adjusted tangible common equity below zero. The narrative at the time was that this was merely a liquidity crisis and an isolated incident, but it was far from the truth. Other significant-sized big bank failures would follow at Signature and First Republic which faced similar fair-value losses on their Treasury holdings. The narrative, however, has remained that these were isolated incidents and mere liquidity issues. We disagree and believe there are still significant hidden, though yet unrealized, losses at some banks lurking.
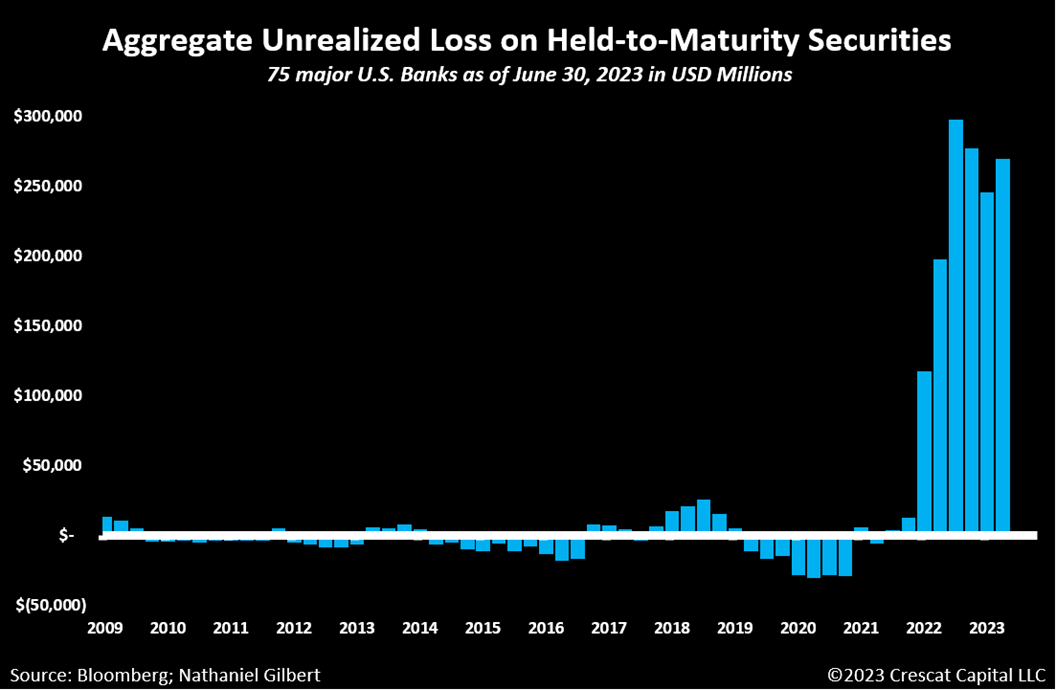
As of June 30, 2023, 75 of the largest banks in the United States are still using the HTM classification to mask a combined total of $266 billion in unrealized losses. To date, that number is likely higher due to additional interest rate increases. If the HTM securities were marked to market, the tangible common equity of these banks would decrease by an average of 17%. In total, we believe bank stocks can survive this hit, and depositors can be made whole, but at least one large one, in our analysis, still faces a serious solvency problem at the common stock level that is not fully appreciated and is a major risk to its stock price.
While from the bank’s perspective, classifying securities as HTM appears to be a great accounting trick to avoid reporting losses on their balance sheets, it does come at a cost, liquidity. Once classified as HTM, the bank must hold that security until it matures. They are not allowed to sell a HTM security in response to changes in interest rates, prepayment risk, the bank’s liquidity, funding sources, etc. If an entity does sell or transfer a HTM security, it calls into question its ability and intent to hold all securities classified as HTM. This can result in the tainting of its entire HTM portfolio which would force them to reclassify all securities as AFS. This in turn means marking all those securities to market value and suddenly, the hidden losses are hidden no more.
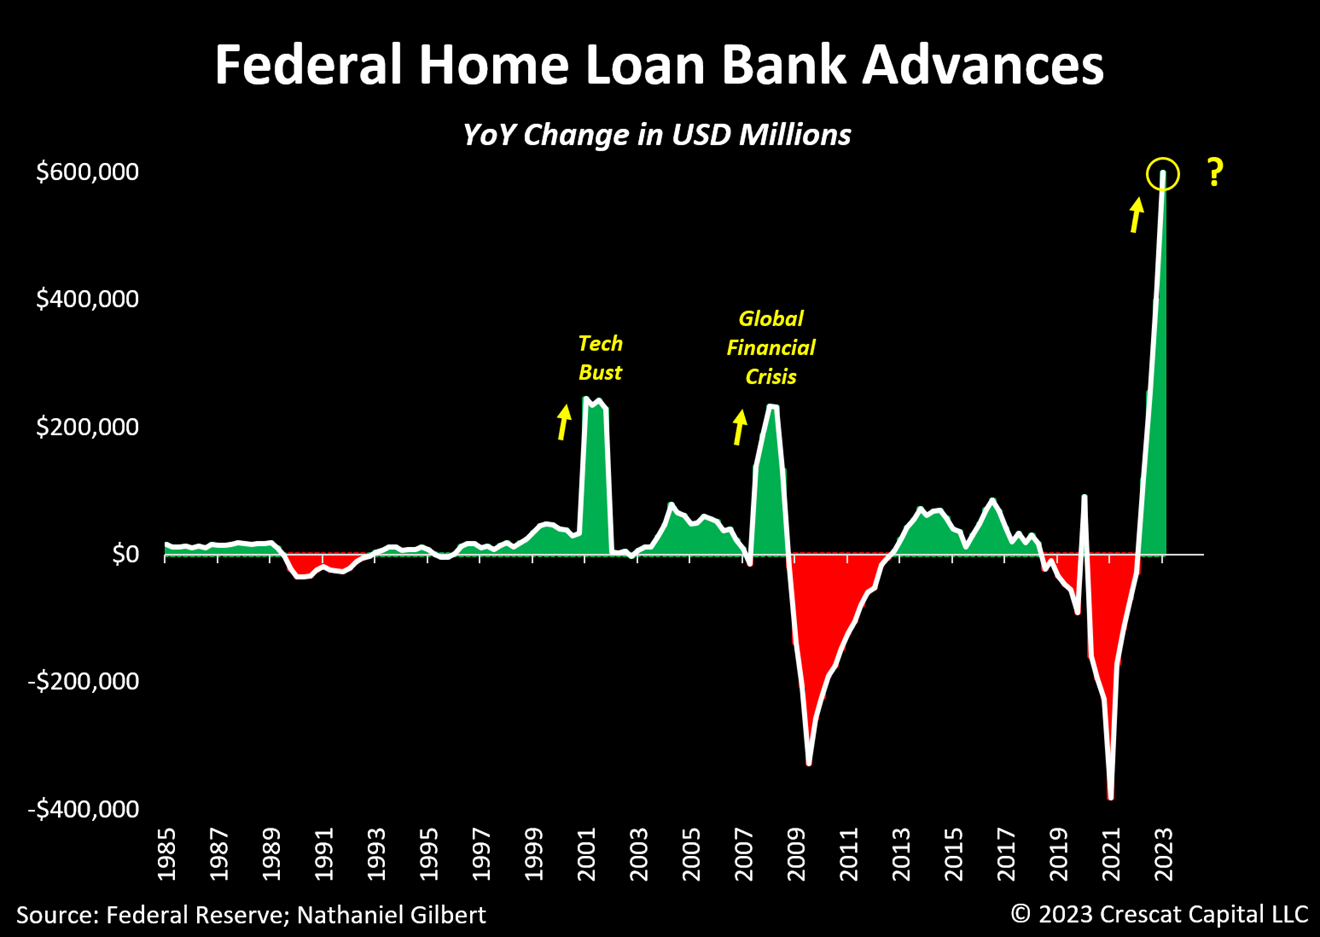
A bank can receive cash advances from their district’s Federal Reserve Bank, but doing so often comes along with unwanted attention and questions regarding their solvency. The preferred, discrete lender of last resort is the Federal Home Loan Bank (FHLB). Leading up to both the tech bust and global financial crisis, financial institutions began ramping up their borrowing from the FHLB, and it’s happening again now at an unprecedented rate. The writing on the wall is clear, when financial institutions are in distress and face liquidity challenges, they call the Federal Home Loan Bank. Both Silicon Valley Bank and First Republic Bank appeared on the FHLB top 10 borrowers list ahead of their failures.
The current state of the banking industry is the true definition of the classic idiom, “being caught between a rock and a hard place.” They created investment portfolios based on an economic climate that wouldn’t last; when the post-Covid boom cooled, inflation ticked up, and interest rates began to rise, they doubled down on their decisions and attempted to weather the storm. There is indeed a liquidity problem throughout the banking industry, and it could lead to more solvency problems. Banks are unable to sell 45% of their short & long-term investments because they are classified as HTM and doing so would result in the reclassification to AFS, exposing them to mark-to-market losses that they have been attempting to avoid. If long-duration Treasury yields continue to rise, these losses would become worse.
There is no easy solution to the unrealized and unmarked HTM loss problem. If long-term rates continue to rise, we think banks will have little choice but to raise dilutive equity capital at the same time as they are under distress. This would not be positive for their stock prices.
It is Not all Doom and Gloom
According to our models, there is deep undervaluation and substantial upside return potential in the commodity and scarce natural resource side of the financial markets today.
Some of the highest appreciation potential in our view is in high-quality exploration-focused mining stocks that are building new viable metal resource ounces in the ground through drilling and discovery. In our analysis, that is the highest wealth-creation phase of the mining industry value curve. With the credentials and deep industry experience of Quinton Hennigh, PhD, Crescat’s geologic and technical director to help guide us, Crescat has built an exciting portfolio of tier-1 exploration projects.
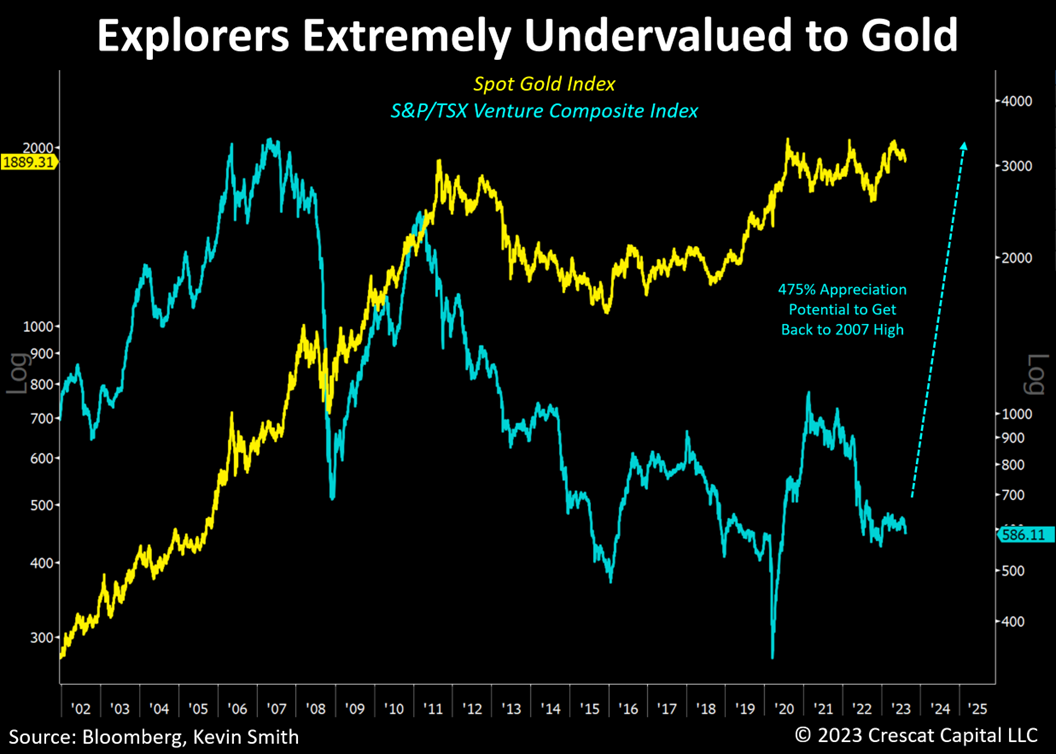
Crescat’s significant long-activist metals exposure is about bringing institutional capital to the capital-starved exploration industry. This critical segment of the mining industry offers the potential for extraordinary risk-adjusted returns ahead of a secular commodity bull market. High-quality explorers in particular are likely to benefit from a robust new M&A cycle after more than a decade of underinvestment by the major producers.
Many of the stocks in this already beaten-down sector have incredibly low valuations and implicitly too-high risk premia. They have extraordinarily high growth and appreciation potential not only during the likely coming stagflationary recession but also in the commodity investment boom that should drive the eventual recovery.
Great Rotation
Once per business cycle, tactical-oriented investors are given the opportunity to act ahead of a recession. The timing is never a slam dunk, but sometimes the signals are so strong and the securities mispricings so extreme, that action is warranted. At Crescat, we think now is one of those times.
Getting the important nuance of whether the coming downturn is likely to be inflationary or disinflationary one is crucial to investment success. Companies that own scarce natural resources are likely to benefit substantially in the stagflationary contraction that we foresee based on our macro and fundamental analysis. There is a huge, long-side market opportunity here that we think far too many investors who might agree with the recession call are likely to miss. Those who could miss it are the ones with a backward-looking deflationary bias.
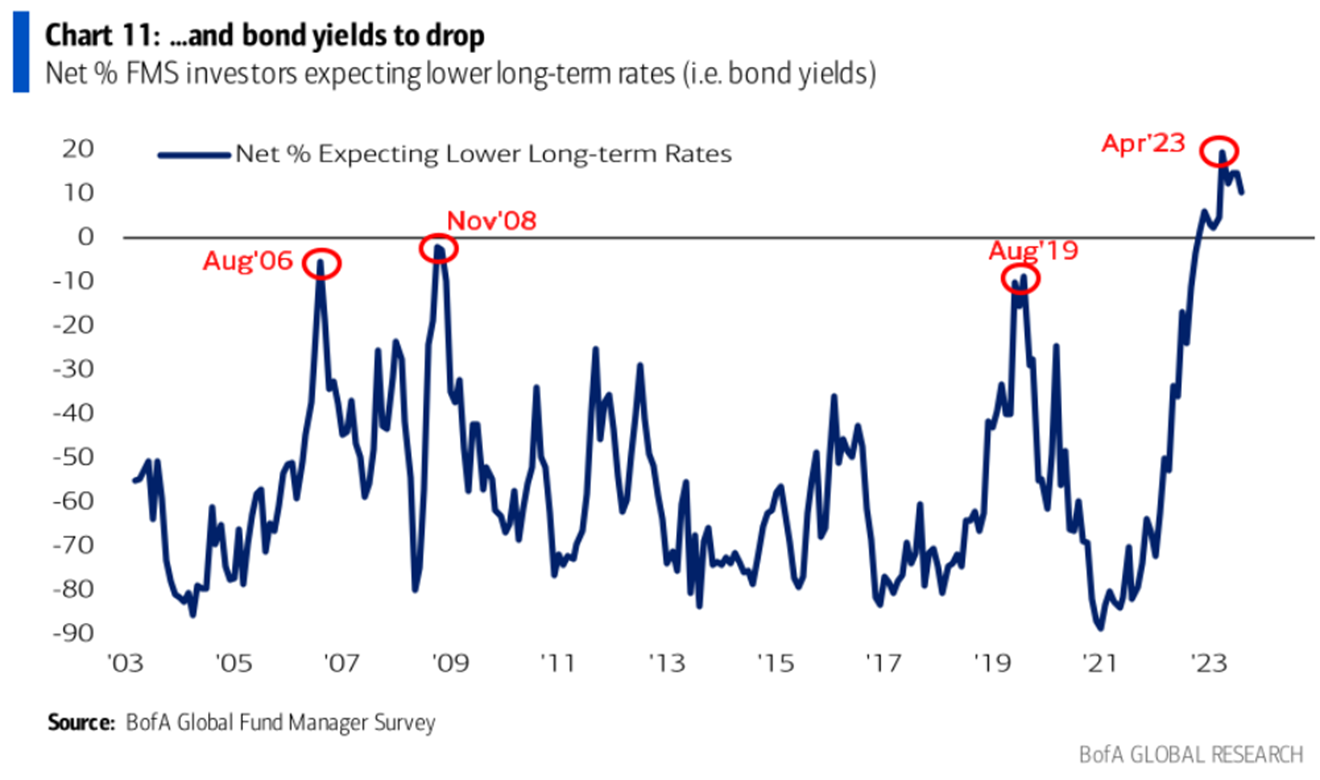
We believe such thinking is pervasive and a crowded trade. That is the major reason commodity stocks are so undervalued. Recession deflationists are more inclined to buy long-term Treasury bonds than they are to buy commodities. We call this fighting the last war. Yet stagflationary recessions happen too, and they are quite different than deflationary ones. It is not just banks that have been wrongfooted on this trade to date. Fund managers have gotten it wrong too and their positioning on the long end of the Treasury curve remains historically crowded according to the BofA Global Fund Manager survey.
It is not just banks that have been wrongfooted on this trade to date. Fund managers have gotten it wrong too and their positioning on the long end of the Treasury curve remains historically crowded according to the BofA Global Fund Manager survey.
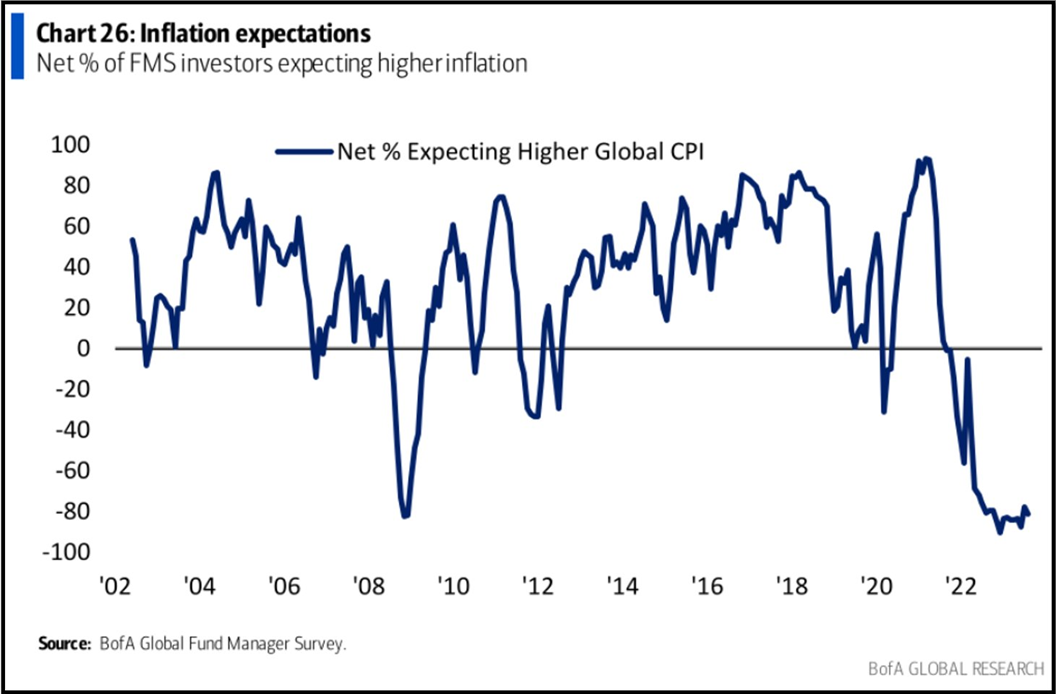
Similarly, inflation expectations have already come down substantially in the last year while structural inflationary forces persist. In our analysis, a second wave of inflation will soon emerge driven by large fiscal deficits, wage inflationary pressures, manufacturing onshoring, and commodity supply shocks.
Now more than ever, we believe it is time for investors to rotate out of historically overvalued financial assets and into historically undervalued critical resources.
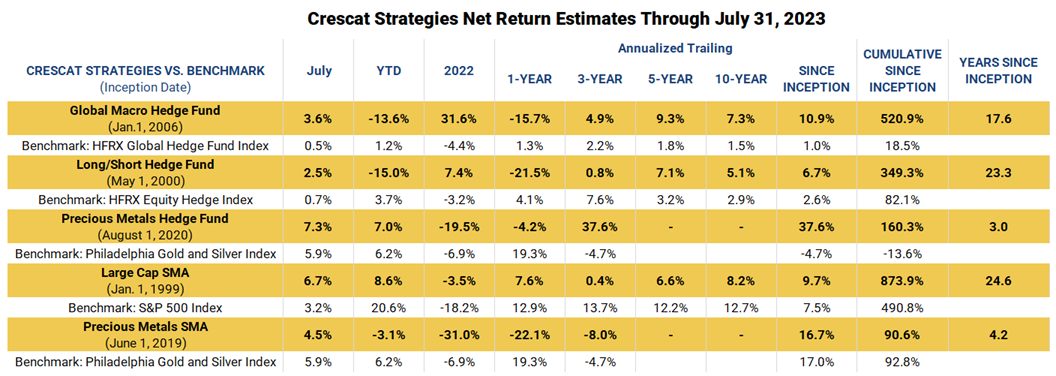
Performance data represents past performance, and past performance does not guarantee future results. Performance data is subject to revision following each monthly reconciliation and/or annual audit. Historical net returns reflect the performance of an investor who invested from inception and is eligible to participate in new issues. Net returns reflect the reinvestment of dividends and earnings and the deduction of all fees and expenses (including a management fee and incentive allocation, where applicable). Individual performance may be lower or higher than the performance data presented. The performance of Crescat’s private funds may not be directly comparable to the performance of other private or registered funds. The currency used to express performance is U.S. dollars. Investors may obtain the most current performance data and private offering memorandum for Crescat’s private funds by emailing a request to info@crescat.net.
Bloomberg Hedge Fund Newsletter
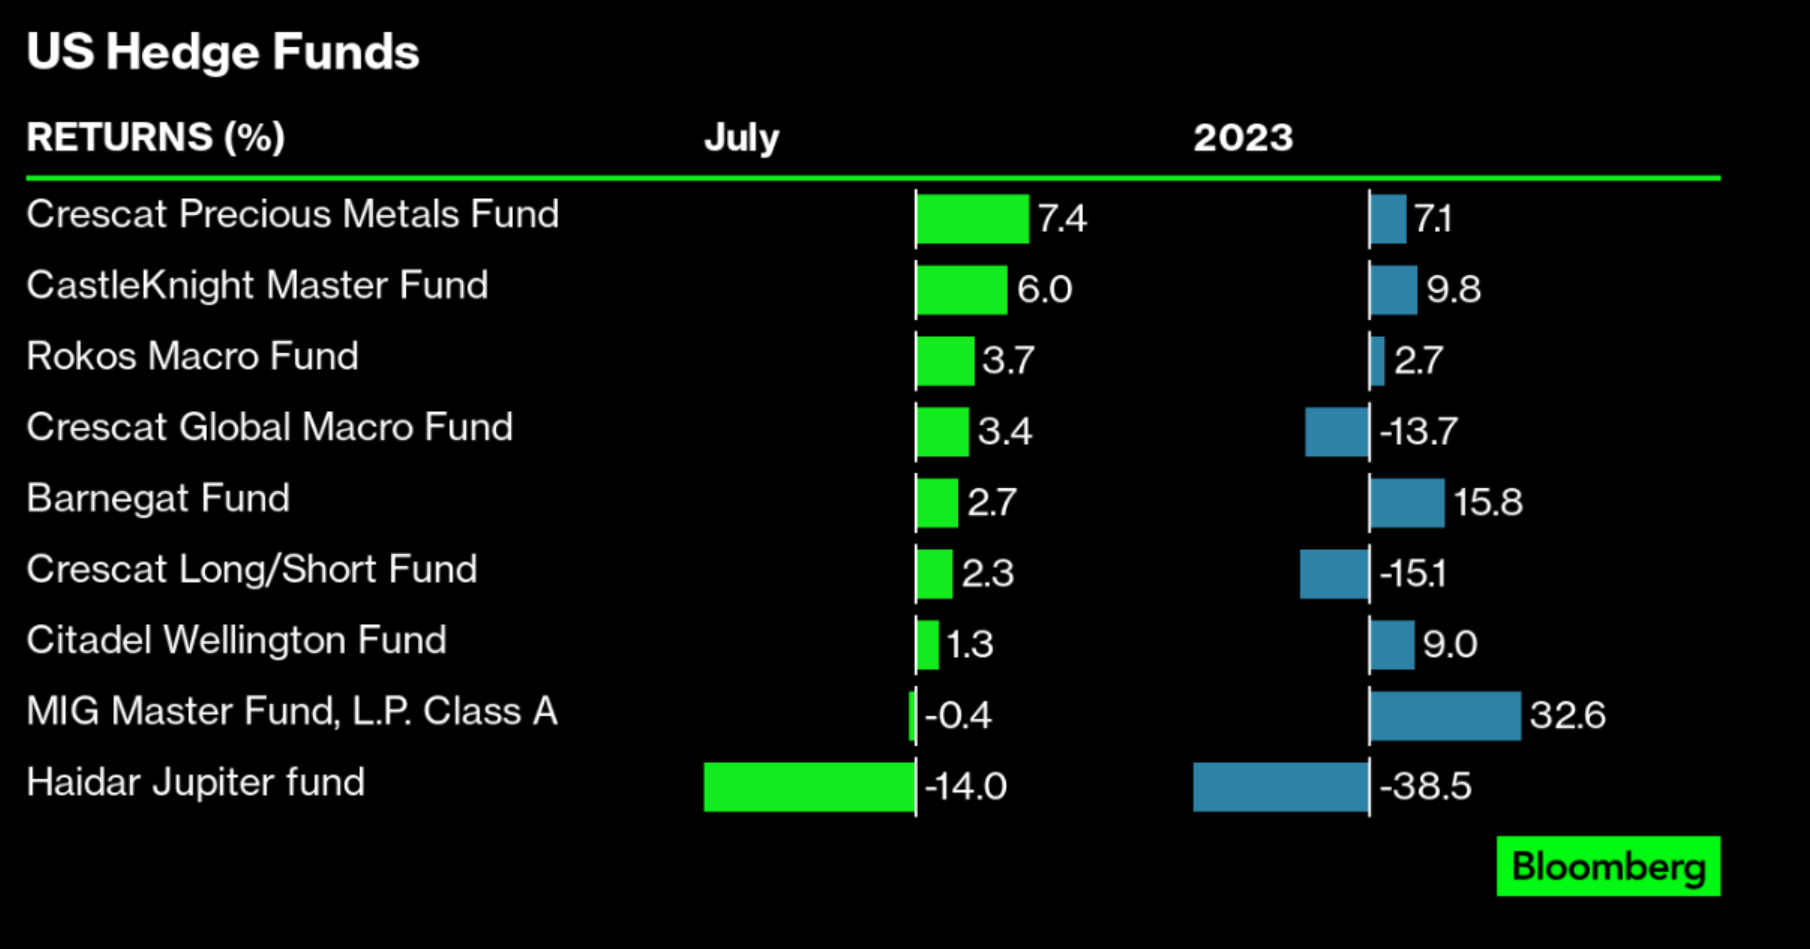
Our Precious Metals Fund was the top-performing hedge fund in July 2023 among those covered in the Bloomberg Hedge Fund Newsletter. The Global Macro Fund and Long Short Fund also made the list with positive performance for the month.
We strongly encourage you to reach out to us if you are interested in learning more about our strategies. You can email or call Marek using the contact information below.
Kevin C. Smith, CFA
Founding Member & Chief Investment Officer
Tavi Costa
Member & Macro Strategist
For more information including how to invest, please contact:
Marek Iwahashi
Investor Relations Coordinator
(720) 323-2995
Linda Carleu Smith, CPA
Co-Founding Member & Chief Operating Officer
(303) 228-7371
© 2023 Crescat Capital LLC
Important Disclosures
Performance data represents past performance, and past performance does not guarantee future results. An individual investor’s results may vary due to the timing of capital transactions. Performance for all strategies is expressed in U.S. dollars. Cash returns are included in the total account and are not detailed separately. Investment results shown are for taxable and tax-exempt clients and include the reinvestment of dividends, interest, capital gains, and other earnings. Any possible tax liabilities incurred by the taxable accounts have not been reflected in the net performance. Performance is compared to an index, however, the volatility of an index varies greatly and investments cannot be made directly in an index. Market conditions vary from year to year and can result in a decline in market value due to material market or economic conditions. There should be no expectation that any strategy will be profitable or provide a specified return. Case studies are included for informational purposes only and are provided as a general overview of our general investment process, and not as indicative of any investment experience. There is no guarantee that the case studies discussed here are completely representative of our strategies or of the entirety of our investments, and we reserve the right to use or modify some or all of the methodologies mentioned herein.
This presentation is not an offer to sell securities of any investment fund or a solicitation of offers to buy any such securities. Securities of a fund managed by Crescat may be offered to selected qualified investors only by means of a complete offering memorandum and related subscription materials which contain significant additional information about the terms of an investment in the Fund and which supersedes information herein in its entirety. Any decision to invest must be based solely upon the information set forth in the Offering Documents, regardless of any information investors may have been otherwise furnished, and should be made after reviewing such Offering Documents, conducting such investigations as the investor deems necessary and consulting the investor’s own investment, legal, accounting and tax advisors in order to make an independent determination of the suitability and consequences of an investment in the Fund.
Risks of Investment Securities: Diversity in holdings is an important aspect of risk management, and CPM works to maintain a variety of themes and equity types to capitalize on trends and abate risk. CPM invests in a wide range of securities depending on its strategies, as described above, including but not limited to long equities, short equities, mutual funds, ETFs, commodities, commodity futures contracts, currency futures contracts, fixed income futures contracts, private placements, precious metals, and options on equities, bonds and futures contracts. The investment portfolios advised or sub-advised by CPM are not guaranteed by any agency or program of the U.S. or any foreign government or by any other person or entity. The types of securities CPM buys and sells for clients could lose money over any timeframe. CPM’s investment strategies are intended primarily for long-term investors who hold their investments for substantial periods of time. Prospective clients and investors should consider their investment goals, time horizon, and risk tolerance before investing in CPM’s strategies and should not rely on CPM’s strategies as a complete investment program for all of their investable assets. Of note, in cases where CPM pursues an activist investment strategy by way of control or ownership, there may be additional restrictions on resale including, for example, volume limitations on shares sold. When CPM’s private investment funds or SMA strategies invest in the precious metals mining industry, there are particular risks related to changes in the price of gold, silver and platinum group metals. In addition, changing inflation expectations, currency fluctuations, speculation, and industrial, government and global consumer demand; disruptions in the supply chain; rising product and regulatory compliance costs; adverse effects from government and environmental regulation; world events and economic conditions; market, economic and political risks of the countries where precious metals companies are located or do business; thin capitalization and limited product lines, markets, financial resources or personnel; and the possible illiquidity of certain of the securities; each may adversely affect companies engaged in precious metals mining related businesses. Depending on market conditions, precious metals mining companies may dramatically outperform or underperform more traditional equity investments. In addition, as many of CPM’s positions in the precious metals mining industry are made through offshore private placements in reliance on exemption from SEC registration, there may be U.S. and foreign resale restrictions applicable to such securities, including but not limited to, minimum holding periods, which can result in discounts being applied to the valuation of such securities. In addition, the fair value of CPM’s positions in private placements cannot always be determined using readily observable inputs such as market prices, and therefore may require the use of unobservable inputs which can pose unique valuation risks. Furthermore, CPM’s private investment funds and SMA strategies may invest in stocks of companies with smaller market capitalizations. Small- and medium-capitalization companies may be of a less seasoned nature or have securities that may be traded in the over-the-counter market. These “secondary” securities 12 often involve significantly greater risks than the securities of larger, better-known companies. In addition to being subject to the general market risk that stock prices may decline over short or even extended periods, such companies may not be well-known to the investing public, may not have significant institutional ownership and may have cyclical, static or only moderate growth prospects. Additionally, stocks of such companies may be more volatile in price and have lower trading volumes than larger capitalized companies, which results in greater sensitivity of the market price to individual transactions. CPM has broad discretion to alter any of the SMA or private investment fund’s investment strategies without prior approval by, or notice to, CPM clients or fund investors, provided such changes are not material.
Benchmarks
HFRX GLOBAL HEDGE FUND INDEX. The HFRX Global Hedge Fund Index represents a broad universe of hedge funds with the capability to trade a range of asset classes and investment strategies across the global securities markets. The index is weighted based on the distribution of assets in the global hedge fund industry. It is a tradeable index of actual hedge funds. It is a suitable benchmark for the Crescat Global Macro private fund which has also traded in multiple asset classes and applied a multi-disciplinary investment process since inception.
HFRX EQUITY HEDGE INDEX. The HFRX Equity Hedge Index represents an investable index of hedge funds that trade both long and short in global equity securities. Managers of funds in the index employ a wide variety of investment processes. They may be broadly diversified or narrowly focused on specific sectors and can range broadly in terms of levels of net exposure, leverage employed, holding periods, concentrations of market capitalizations and valuation ranges of typical portfolios. It is a suitable benchmark for the Crescat Long/Short private fund, which has also been predominantly composed of long and short global equities since inception.
PHILADELPHIA STOCK EXCHANGE GOLD AND SILVER INDEX. The Philadelphia Stock Exchange Gold and Silver Index is the longest running index of global precious metals mining stocks. It is a diversified, capitalization-weighted index of the leading companies involved in gold and silver mining. It is a suitable benchmark for the Crescat Precious Metals private fund and the Crescat Precious Metals SMA strategy, which have also been predominately composed of precious metals mining companies involved in gold and silver mining since inception.
RUSSELL 1000 INDEX. The Russell 1000 Index is a market-cap weighted index of the 1,000 largest companies in US equity markets. It represents a broad scope of companies across all sectors of the economy. It is a commonly followed index among institutions. This index contains many of the same securities as the S&P 500 but is broader and includes some mid-cap companies. It is a suitable benchmark for the Crescat Large Cap SMA strategy, which has predominantly held and traded similar securities since inception.
S&P 500 INDEX. The S&P 500 Index is perhaps the most followed stock market index. It is considered representative of the U.S. stock market at large. It is a market cap-weighted index of the 500 largest and most liquid companies listed on the NYSE and NASDAQ exchanges. While the companies are U.S. based, most of them have broad global operations. Therefore, the index is representative of the broad global economy. It is a suitable benchmark for the Crescat Global Macro and Crescat Long/Short private funds, and the Large Cap and Precious Metals SMA strategies, which have also traded extensively in large, highly liquid global equities through U.S.-listed securities, and in companies Crescat believes are on track to achieve that status. The S&P 500 Index is also used as a supplemental benchmark for the Crescat Precious Metals private fund and Precious Metals SMA strategy because one of the long-term goals of the precious metals strategy is low correlation to the S&P 500.
References to indices, benchmarks or other measures of relative market performance over a specified period of time are provided for your information only. Reference to an index does not imply that the fund or separately managed account will achieve returns, volatility or other results similar to that index. The composition of an index may not reflect the manner in which a portfolio is constructed in relation to expected or achieved returns, portfolio guidelines, restrictions, sectors, correlations, concentrations, volatility or tracking.
Separately Managed Account (SMA) disclosures: The Crescat Large Cap Composite and Crescat Precious Metals Composite include all accounts that are managed according to those respective strategies over which the manager has full discretion. SMA composite performance results are time-weighted net of all investment management fees and trading costs including commissions and non-recoverable withholding taxes. Investment management fees are described in Crescat’s Form ADV 2A. The manager for the Crescat Large Cap strategy invests predominantly in equities of the top 1,000 U.S. listed stocks weighted by market capitalization. The manager for the Crescat Precious Metals strategy invests predominantly in a global all-cap universe of precious metals mining stocks.
Bloomberg News Disclosure: Bloomberg selection criteria is based on returns. The Bloomberg return table was compiled from people familiar, investor letters and other Bloomberg News reporting. The report is written by editor Erin Fuchs of Bloomberg News to acknowledge returns for month and year to date. Crescat Capital did not submit payment, outside of our employees’ Bloomberg subscriptions, for consideration or placement in these rankings. Our ranking may not be representative of any one client’s experience since it reflects the returns of a hypothetical, full fee-paying investor who has invested since inception. Ranking is not indicative of future performance. The displayed table is based on US submissions only and the number of submissions varies on a week-by-week basis. Crescat reports performance estimates and finalized numbers to Bloomberg as they are released and displays both favorable and unfavorable months at the discretion of the Bloomberg News team. Crescat Capital is not affiliated with Bloomberg News
Hedge Fund disclosures: Only accredited investors and qualified clients will be admitted as limited partners to a Crescat hedge fund. For natural persons, investors must meet SEC requirements including minimum annual income or net worth thresholds. Crescat’s hedge funds are being offered in reliance on an exemption from the registration requirements of the Securities Act of 1933 and are not required to comply with specific disclosure requirements that apply to registration under the Securities Act. The SEC has not passed upon the merits of or given its approval to Crescat’s hedge funds, the terms of the offering, or the accuracy or completeness of any offering materials. A registration statement has not been filed for any Crescat hedge fund with the SEC. Limited partner interests in the Crescat hedge funds are subject to legal restrictions on transfer and resale. Investors should not assume they will be able to resell their securities. Investing in securities involves risk. Investors should be able to bear the loss of their investment. Investments in Crescat’s hedge funds are not subject to the protections of the Investment Company Act of 1940. Performance data is subject to revision following each monthly reconciliation and annual audit. Current performance may be lower or higher than the performance data presented. The performance of Crescat’s hedge funds may not be directly comparable to the performance of other private or registered funds. Hedge funds may involve complex tax strategies and there may be delays in distribution tax information to investors.
Investors may obtain the most current performance data, private offering memoranda for Crescat’s hedge funds, and information on Crescat’s SMA strategies, including Form ADV Part II, by contacting Linda Smith at (303) 271-9997 or by sending a request via email to lsmith@crescat.net. See the private offering memorandum for each Crescat hedge fund for complete information and risk factors.